The Pandemic and the Emerging Markets Crisis: How Fragile are the Economies?

Utku Demir and Merih Uctum 
June 11, 2020

The Emerging Market (EM) economies that came out of the 2008 financial crisis relatively faster than advanced economies are hard hit by a quadruple-whammy this time: the pandemic, capital outflows, economic recession, and debt crisis. In March 2020, more than USD100 billion flew out of the EMs.

This analysis looks at the flight to the safety of global investors and its impact on these economies that owe more than $8 trillion in foreign-currency debt.

The EMs have come a long way since the 1990s when they were unable to borrow in their currency, a phenomenon dubbed “the original sin” by Eichengreen and Hausmann, which made them dependent on external financial conditions. Adverse global conditions could lead to capital flight and depreciation of their exchange rate, which pushed their economies into insolvency since the value of the debt burden rose in local currency. If foreign creditors lost confidence in the local economy, they could abruptly reduce the international flow of the capital in the economy. This phenomenon is also often accompanied by domestic residents increasing their investment abroad. Called a “sudden stop,” the abrupt reversal of capital flows would be often accompanied by recession and a currency crisis through a run on EMs currency. During the last several decades, however, following improved economic and financial management and strengthened banking systems, most EMs have been able to borrow in their currencies. Yet, they now face another problem, the “original sin-redux,” as described by Carstens and Shin: since the performance of investors in EMs in local currency is evaluated in USD, a depreciation of the EM currency is costly for investors. So, during an international crisis, this heightened risk leads to capital flight and further depreciation of the currencies.  

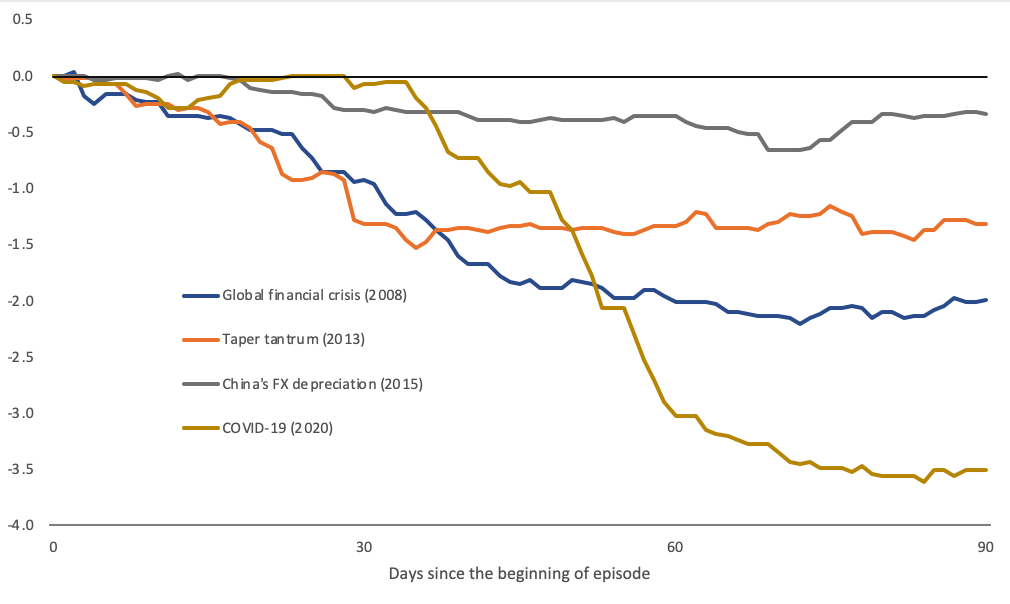
EM economies are no strangers to capital flight. In recent history, several episodes led to capital outflows from these countries. Since the Global Financial crisis, they have been hit by the Taper Tantrum when the Fed decided to stop quantitative easing, which led to a market selloff of EM currencies in a panic; a Renminbi devaluation that reduced its value against the USD for the first time in 20 years and rattled the markets; and the 2018 EM selloff following global trade uncertainties and the strength of the USD. The market panic of this year has been more severe. As the spread of the coronavirus ripped through financial markets and fears of a recession gripped investors, capital flows to EMs collapsed at the onset of the pandemic. Although some of the outflows slowed down and new inflows took place since then, the decline has been much more severe than the financial crisis or any other episode of market disturbance to these economies (Figure 1).

Figure 1. Comparison of portfolio outflows episodes (percent of International Investment Position)

Source: International Monetary Fund, World Economic Outlook, April 2020.

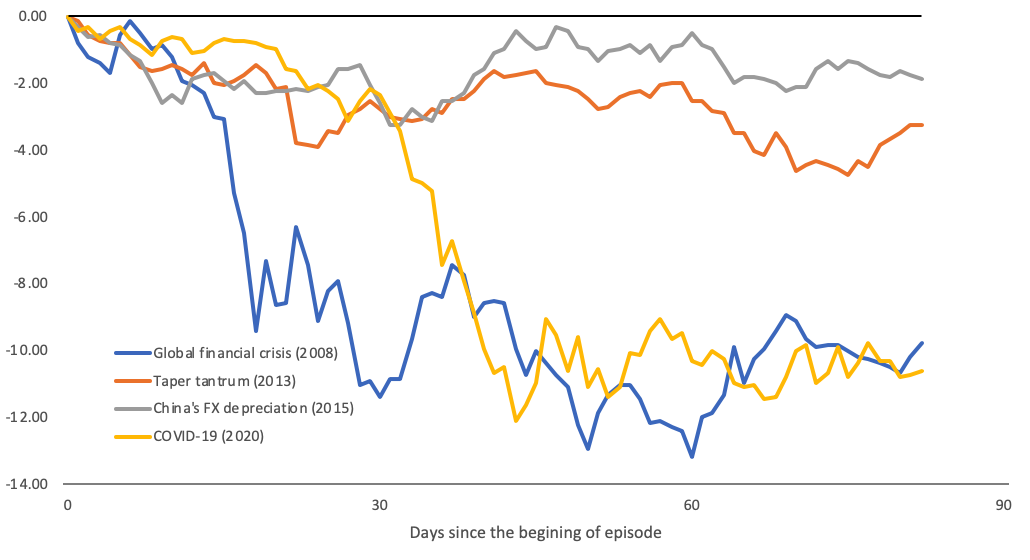
In conjunction with massive capital flight, the value of EM currencies collapsed. Since January 2020, the fall in EM exchange rates due to the pandemic-induced lockdown was compounded by plummeting oil and commodity prices, which adversely affected the exporters. The flight to safety by investors, who piled into the dollar as the virus spread over the continents, exacerbated the free fall of these currencies. Figure 2 depicts the change in the value of EM currencies since the beginning of each episode. In the first 90 days of the pandemic, the decline in the currencies was severe but more abrupt than the decline during the same period of the Great Financial crisis.

Figure 2. Comparison of currency depreciation episodes (bilateral EM rates against the US$)

Source: Federal Reserve Economic Data and authors’ calculations. EM economies include China, Mexico, Korea, India, Brazil, Taiwan, Singapore, Hong Kong, Vietnam, Malaysia, Thailand, Israel, Indonesia, Philippines, Chile, Colombia, Saudi Arabia, Argentina, and Russia.

Not all countries have been impacted by capital flight in the same way. To examine this, we can consider variations in exchange-traded funds (ETFs). 

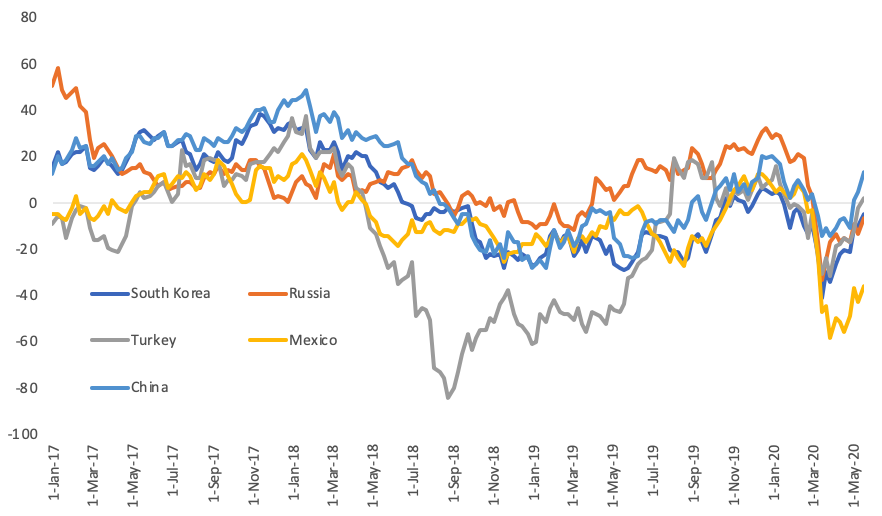
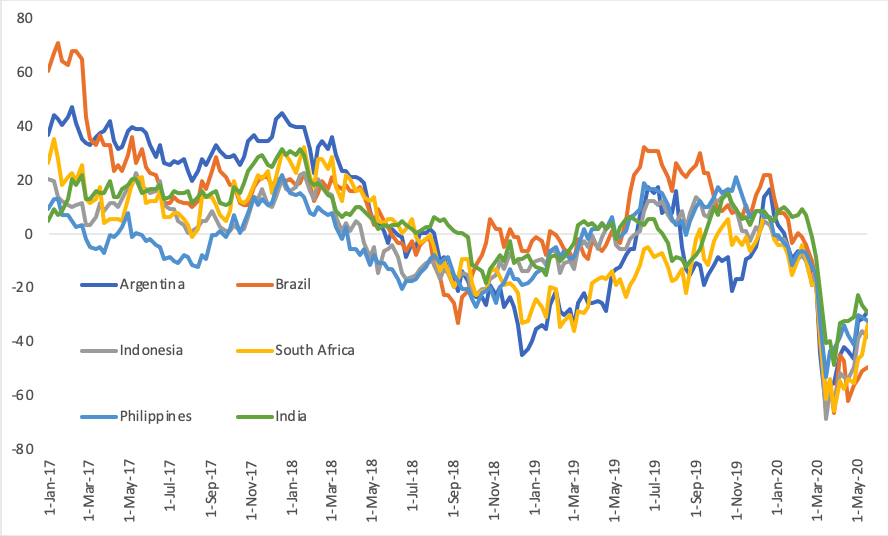
An ETF is a type of investment fund that consists of portfolios that track the price and yield of an underlying index. As such, EM ETFs are readily available and can give an understanding of the recent fluctuations in portfolio flows from these economies. Earlier in the year, most EMs, except for the Philippines, have seen sharp declines in net ETF positions, which shows the extent of capital flight from these economies in March (Figure 3). The outflow was abrupt and substantial, paralleling the collapse of their currencies. 

Although the net positions subsequently improved, they remain well below the 2018 levels.

Figure 3: Exchange-Traded Funds (year-over-year percent change)

Source: Investing.com, ETF Equities in the United States Market, issuers: iShares for all countries except Argentina. The issuer for Argentina: Global X

As a result of these massive shocks, EM economies are grappling with the fallout from the pandemic, shutdowns, loss of cheap financing, a staggering recession both at home and abroad, and an inability to service their debt to foreign creditors. Despite the G20’s initiative to suspend debt repayment by the poorest countries, it does not cover the debt owed to private creditors. Further, many EM countries are excluded from this deal; several of them are therefore facing a risk of default, as illustrated by Argentina’s May 22 default, its 9th since 2001.

To analyze the severity of default risk, various indicators are used to assess the vulnerability of economies to sudden stops. 

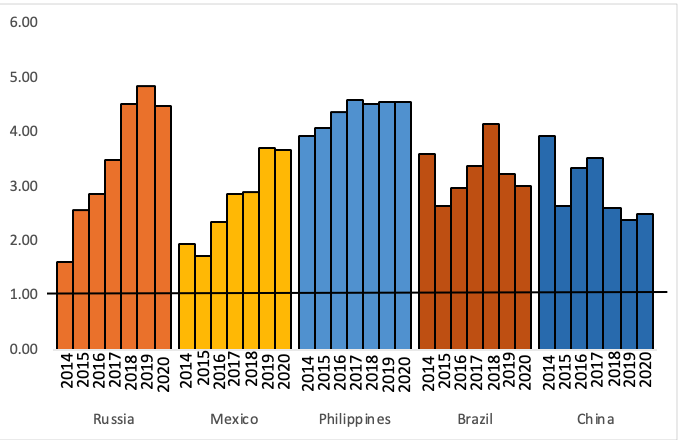
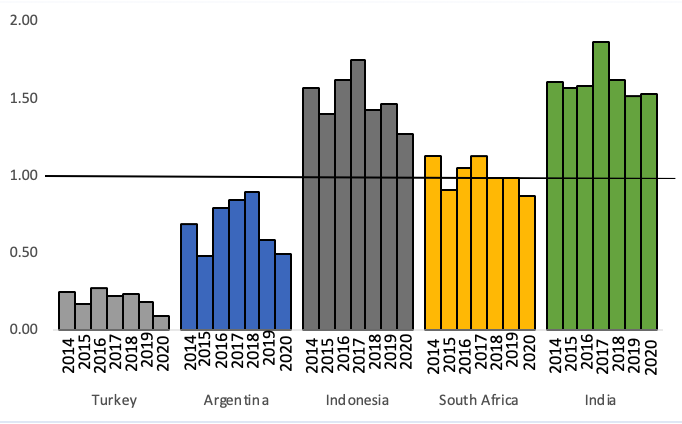
Typical indicators include the level of external debt as a share of exports, the ratio of debt service to international reserves, and the ratio of current account balance to GDP. In this analysis, we will instead use the Guidotti-Greenspan rule, since it compares the country’s international reserves to its short-term external debt with a maturity of one year or less. If the ratio is greater than or equal to 1, then the economy has built sufficient reserves to weather a massive flight of short-term capital for one year (Figure 4).  

Figure 4: Guidotti-Greenspan rule of reserve adequacy (Reserves/short-term external debt by remaining maturity)

Source: SP Global Ratings, Sovereign Risk Indicators 2020 Estimates, as of April 24, 2020, and authors’ calculations.

Argentina and, in particular, Turkey stand out as having chronically inadequate international reserves to resist a sudden stop of capital flows. In 2020, South Africa fell into the same category of dangerously low reserves. India and Indonesia are currently in a relatively safe zone. They both have just sufficient reserves to cover a short-term crisis, although Indonesia’s ratio has been declining since 2017. If the EM crisis deepens, both of these economies are likely to suffer from a run on reserves. The other five countries, Brazil, China, Mexico, the Philippines, and Russia, have sufficient reserve adequacy without needing foreign borrowing for at least one year.

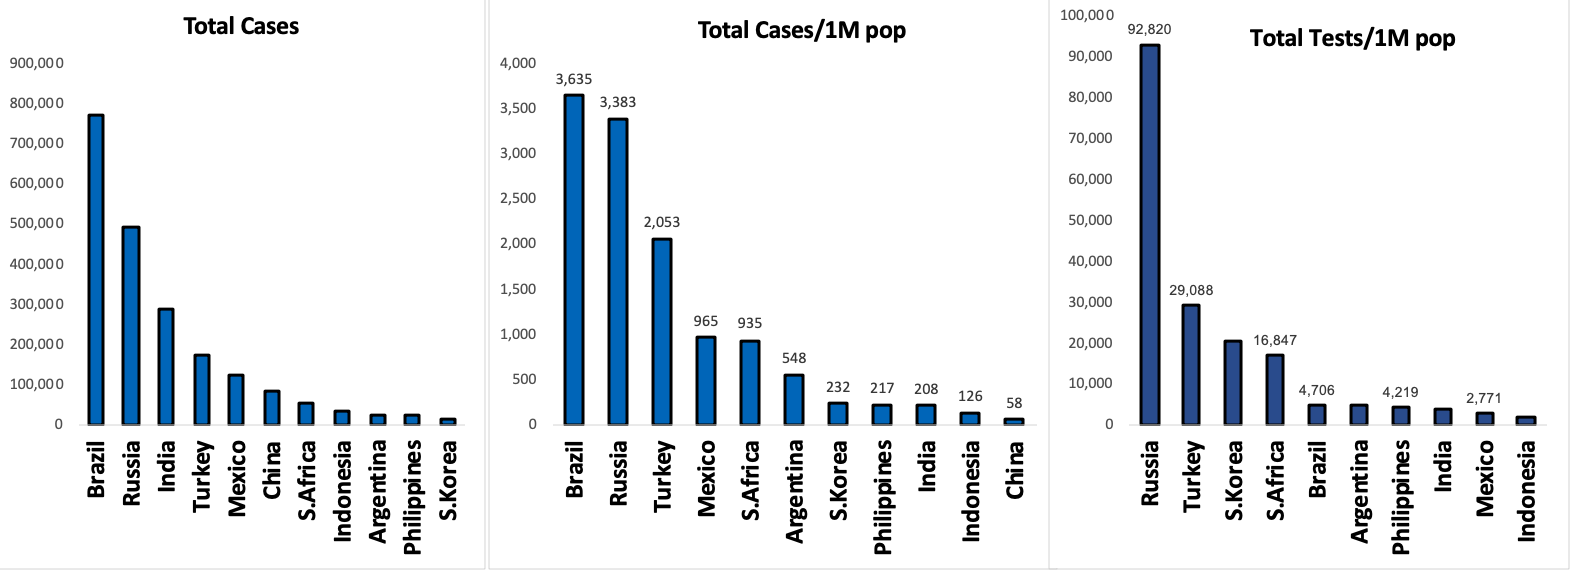
These conclusions should be evaluated against the current health crisis that the economies are facing. If a country’s health system is overwhelmed by infected people who need to be hospitalized, the economy’s opening will only aggravate the crisis and delay recovery. Figure 5 displays total cases, cases per 1 million population, and tests per 1 million population.

Figure 5: Total cases of infection as of June 6/2020
Source: https://www.worldometers.info/coronavirus/?utm_campaign=homeAdvegas1?

Despite Brazil and Russia satisfying the reserve adequacy criterion, they have the world’s second and third highest numbers of cases respectively after the United States and are ranked above all the EM countries in our analysis (first panel). Brazil is holding second place worldwide even after accounting for the population; among the EM countries studied, it has the highest cases per 1 million people (second panel). Some political leaders argue that high numbers only reflect high rates of testing.
If a country has high testing and high number of cases, then this is a valid argument. However, if there are low testing and a high number of cases, then this is not the case–in fact, the actual number of cases is likely to be even higher than the official numbers. In regards to testing, the worst performing countries in our sample are mostly those economies satisfying the reserve adequacy condition: Brazil, the Philippines, India, Mexico, and Indonesia (third panel). Argentina stands out as deficient in both reserve adequacy and testing. With low rates of testing and increasing numbers of infections, India and Indonesia are in danger of facing adverse economic conditions and/or a financial crisis.
EM economies are facing a rare case of twin crises, economic/financial, and pandemic. These potentially amplify each other and therefore need to be addressed simultaneously. Countries that tackle the health crisis as seriously as the economic slowdown are expected to fare better and return to attracting foreign investment in a virtuous cycle. By contrast, countries prioritize solving the economic crisis over protecting people for a rough ride.



The Pandemic and the Emerging Markets Crisis: How Fragile are the Economies?2020-06-15T08:07:05+00:00

Lessons from Taiwan’s Healthcare Reform

William B. Thorne
November 27, 2019

Taiwan’s National Health Insurance Overhaul

Taiwan’s single-payer National Health Insurance system was implemented in 1995 and designed using the U.S. Medicare program as a template. At a time when the future of the US healthcare system is an important topic that is likely to affect election results, what lessons can we draw form the Taiwanese experience?  The switch to a single-payer system is appealing to study because it was a fundamental change and restructuring of how healthcare was provided, not a relatively small tweak to funding. The more major and transformative a change is made in a short time period, the easier it becomes  to detect effects in the data. Taiwan was one such major shift and it saw many improvements in health outcomes after the change. However, it is possible that those improvements would have happened anyway without the change in system; we do not know what health outcomes in Taiwan would have been without the change in its healthcare system. We can’t observe Taiwan with and without the policy reform, but statistical techniques allow us to get an  estimate of the causal effect of the healthcare reform on health outcomes. In this post we outline the key components of Taiwan’s healthcare reform and report the results of our analysis that show how the policy reform led to fundamental healthcare improvements.

Major Changes to Taiwan’s Healthcare System

Chen Shih-Chung Minister of Health and Welfare for Taiwan, summarized the 1995 switch:

National Health Insurance (NHI) integrated medical programs from existing insurance systems for laborers, farmers, and government employees, which covered only half the population, and has since been expanded to provide equal coverage to all citizens from birth, regardless of age, financial status or employment status. Furthermore, all foreigners who legally work or reside in Taiwan are also afforded the same coverage… Yet healthcare costs are far lower in Taiwan than in most highly developed countries in Europe and North America, at $1,430 per capita per year.

For the average person in Taiwan, the change meant that, when you use the healthcare system rather than buying insurance and billing the insurance company, your bill would be sent to the government with little or no payment out of pocket.  Healthy people enter the system to share the costs of healthcare; coverage in Taiwan increased dramatically, from 57% to 99%, and approval ratings for the program have been high.

The government can bargain and control costs and to distribute them through taxation. It also allows for economies of scale in administration, rather than each insurance company conducting its own administration. The administrative costs are now some of the lowest in the world, being around 2% of total healthcare spending.   By reducing the need to make a payment when visiting a doctor, people may be more inclined to visit a doctor before their illness gets worse. High-quality, available, preventative care might save on healthcare costs in the long run. Ultimately these are claims that must be assessed by what we see in the data. Comparing the results Taiwan saw after the reform with what Taiwan would have been like without the reforms, is the key problem researchers must solve.

How to Assess the Impact of Taiwan’s Healthcare Overhaul

A neat solution to the issue of what Taiwan’s healthcare system would have looked like absent the policy change, is the “Synthetic Control Method.” It works in the following way: consider Taiwan in the time period before their 1995 healthcare reform. Selecting several control countries whose life expectancy data, when combined, follow Taiwan’s data quite precisely for the years prior to 1995, we could expect them to continue to do so afterwards. Only the real Taiwan data will have the effect of the 1995 healthcare reform. Therefore, the difference we observe in outcomes between the synthetic group and the real Taiwan data can be considered the effect of the healthcare reform. For example, the synthetic group for Taiwan could be made from a weighted average of 40% Japan, 40% China, and 20% the United States, meaning these countries have data that look most like Taiwan from 1960 to 1994. In the post-reform period, keeping those same countries we get data that represent what Taiwan would look like post-1995 which can be compared to Taiwan’s actual data, and we can observe the difference. This method avoids the potential bias of selecting one particular country to judge the size and sign of the healthcare reform’s effect.

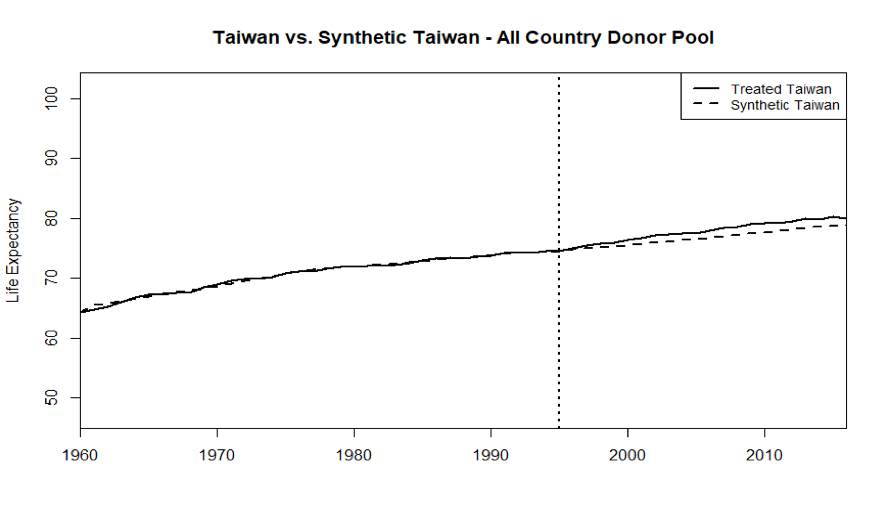
We use the post-reform data on the change in life expectancy as one measure of the new program’s impact. The complete dataset includes yearly life expectancy for Taiwan and 187 countries from 1960 to 2016. The basic model considered here takes data from all the available countries to calculate the synthetic control group, or Synthetic Taiwan. The top weights for the Synthetic Taiwan are: Japan 22%, United States 19%, Montenegro 16%, Armenia 9%, Iceland 6%, and others at less than 5%. The list is a mix of intuitive choices for comparisons, as well as some that are not quite as clear. This is the advantage of the Synthetic Control Method: because it is data-driven it chooses the countries that are most similar, and not just those that are perceived as similar.

Figure1. Life Expectancy Taiwan and Synthetic Taiwan

Figure 1 shows the output of this basic synthetic control model. The dotted line indicating life expectancy in years in the Synthetic Taiwan sits right on the solid line for Taiwan in the 1960-1994 pre-reform period. That means the country weights described above recreate the real Taiwan quite well.   After the 1995 healthcare reform we see a gap emerge as Taiwan’s life expectancy rises faster than in the Synthetic Taiwan. This means Taiwan’s healthcare reform improved life expectancy outcomes relative to what would have happened without the reforms (represented by the synthetic)

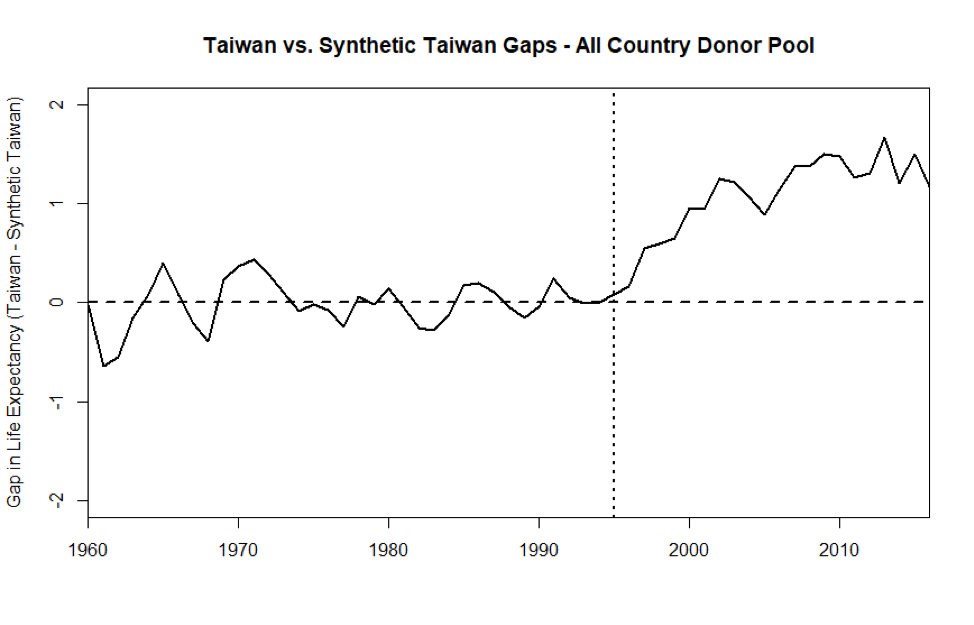
Figure2 presents the same information as the figure above, but shows the subtraction of the two lines plotted so the y-axis can be understood as the difference in life expectancy between the actual Taiwan and Synthetic Taiwan. In the 10 years immediately after the policy was implemented, Taiwan improved its life expectancy by roughly a year or more relative to the Synthetic. 

Figure 2.  Life Expectancy Gaps Taiwan and Synthetic Taiwan – All Country Donor Pool

Conclusion

Although preliminary, there are some lessons one can potentially take away from our look at Taiwan’s healthcare reform. Often countries are compared without a real reckoning of what those countries were like before reforming their systems nor what would have happened in the absence of a reform. The synthetic control method provides an opportunity to get at the true effect of these differing health system models, assuming no major changes occur in the control group. Here, life expectancy in a synthetic control group keeps very close to the actual life expectancy data in Taiwan in the pre-reform period, but then actual life expectancy immediately and unambiguously moves upwards after the 1995 healthcare reform. Given the results of Taiwan’s move to a single-payer system, there could be real gains in life expectancy, and likely other health outcomes as well.

In an interview with Jonathan Cohn for “The Treatment”, The New Republic’s healthcare blog, Dr. Michael Chen, Vice President and CFO of Taiwan’s National Health Insurance Bureau said:

We sent our people around the world to learn their programs, including the United States. Actually, the program is modeled after Medicare. And there are so many similarities – other than that our program covers all of the population, and Medicare covers only the elderly.

This Taiwan “Medicare For All” example shows potential benefits to other countries of potentially switching to such a system. It was not the case that the people of Taiwan were uniquely healthy, or long-living before the implementation of their new system, so that the reform itself had no effect. It is argued in the U.S., that the U.S. is less healthy due to poverty or obesity not our healthcare system. Given the results shown by Taiwan’s reform, this is not a sufficient explanation: major healthcare reforms can affect health outcomes. Of course, there will be unique challenges if the United States switches to a new healthcare system; Taiwan experienced a spike in administrative costs the first few years, and the U.S. might expect something similar. However, it seems clear from these preliminary results that the U.S. could also reasonably expect some improvements in health outcomes and cost savings after making a switch. Taiwan pays a fraction of the drug prices (for the same drugs) that the U.S. does, pays 6.1% of GDP on healthcare as opposed to 17.2%, pays 0.77% of total healthcare spending on administrative costs compared to 13% in the U.S., and Taiwan visits the doctor at three times the rate of the U.S.; we should learn from Taiwan’s single-payer healthcare reform.


Lessons from Taiwan’s Healthcare Reform2019-12-03T19:02:49+00:00

Unconventional Monetary Policies Become Conventional After All?

Fotios Siokis
October 21, 2019

What are unconventional monetary policies? How are they implemented in the European Union? What does the future look like? In this article we address these questions. On September 12,2019, the President of the European Central Bank (ECB) announced a new monetary stimulus package, prompted by the entrenched low inflation rate and an economic slowdown that has proved to be more protracted than initially expected. The inflation and economic growth prospects in the euroarea, which were both revised downward to 1.2% and 1.1% for this year and 1.0% and 1.2% in 2020 respectively, have taken a heavy toll due to the persistent weakness in manufacturing and extraordinary uncertainty concerning international trading arrangements and geopolitical alignments.

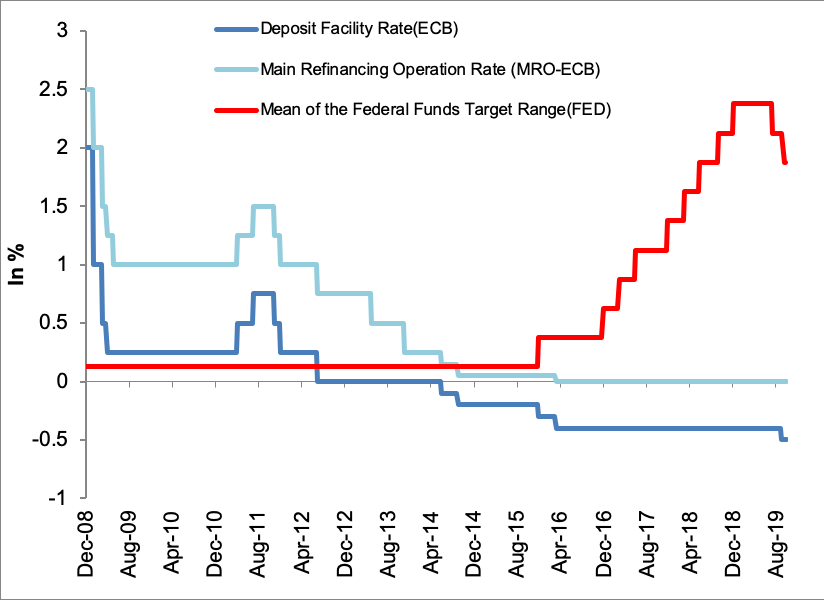
A zero lower bound (ZLB) on the Main Refinancing Operation interest rate (currently at zero and equivalent to the Federal Reserve’s target rate) had eroded the use of traditional monetary tools, prompting the ECB to adopt unconventional measures. These were first introduced in early 2000 by Japan in its battle against deflation and had been previously employed in periods of heightened financial distress amid severe economic downturns, such as the recent Great Recession in the United States and the great sovereign and banking crisis in the euro area. Table 1 outlines these complementary monetary measures.

Table 1: ECB’s monetary policy decisions as of September 12, 2019
Tools Action Taken
Deposit (overnight facility) rate Rate decrease to -0.5% from -0.4%
Two-tier system Introduction of two-tier system for reserve remuneration
Forward Guidance Measures will remain at work until projected inflation stabilizes close to but lower than the targeted 2%
Quantitative Easing (QE) Restart asset purchase program at a monthly pace of €20 bn from November 1 until the ECB begins to raise key interest rates.
Targeted Longer-term Refinancing Operations (TLTRO) Lower interest rates for loans while maturity extends from 2 to 3 years
Source: ECB

Monetary Policy Tools Εxplained

  1. Deposit (overnight) facility rate. Unlike the Main Refinancing Operation rate that remained at the zero level (figure 1), the deposit rate – the rate that the ECB remunerates for deposits that commercial banks hold at the central bank, in excess of the required reserves – decreased by 10 basis points, from -0.4% to -0.5%.

Figure 1. Deposit rate and the (a)synchronization of the main intervention rates
Sources: ECB and Federal Reserve

The negative deposit rate is a policy measure aiming at decreasing the yield curve at all maturities. It is designed to encourage commercial banks to lend their excess liquidity to households, firms, financial intermediaries, or to invest it in sovereign bonds, rather than to “stash” it in the Central Bank. Although this measure is intended to provide extra liquidity, critics argue that negative rates may adversely affect the profitability of the fragile European banking system. To the extent that a negative overnight rate reduces longer-term interest rates, the income that banks earn from interest bearing financial assets, such as bonds or mortgages, is reduced. Furthermore, the possibility that negative rates may lead to less lending and more risk taking by high-deposit banks cannot be ignored. Neither can the fact that negative rates could be passed on to corporate depositors and savers. For these reasons, the ECB introduced a two-tier system for the banks, under which a portion of reserves, set up to six times the mandatory reserves they hold at the Central Bank, will be exempt from negative rates and earn 0%, while the rest of the reserves will be subject to the -0.5% rate.

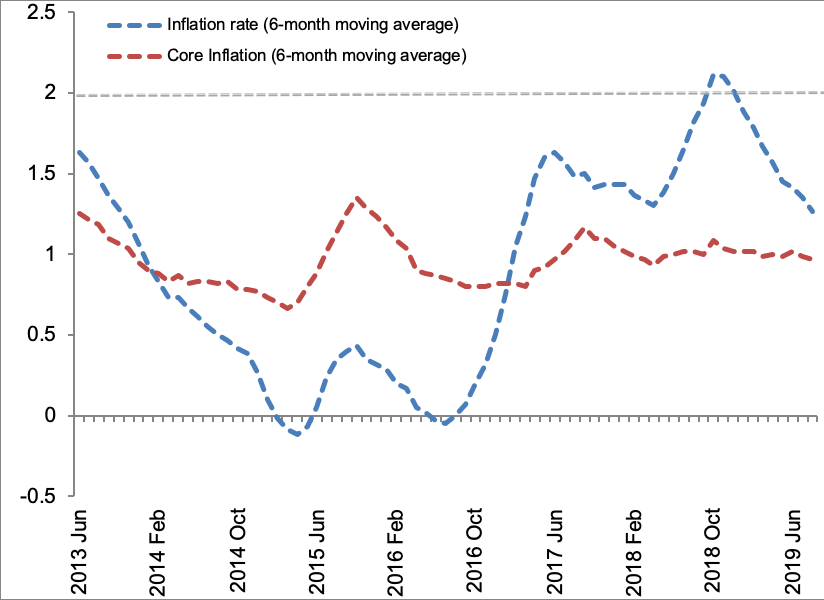
  1. Forward guidance. Forward guidance occurs when Central Banks communicate with the public about the current state of the economy and the future path of monetary policy. By revealing the path of policy rates, the ECB seeks to influence longer term interest rates and to reduce uncertainty about the mean and variance of asset prices. Central Banks have used two types of forward guidance policy so far: the time- or calendar-dependent guidance and the state-dependent commitment. The ECB’s forward guidance announcement along with the deposit facility rate is state-dependent, conditional on the inflation outlook. The ECB states that as long as the inflation rate remains low and away from the targeted level (close to but less than 2%, as shown in the figure below), the interest rates and the other unconventional monetary policy measures will be accommodative. This is called an “Odyssean guidance” – a form of commitment where the Central Bank pledges to stay on course regarding the interest rate path and other accommodative measures.

Figure 2. Inflation rates in the euro area
Source: ECB
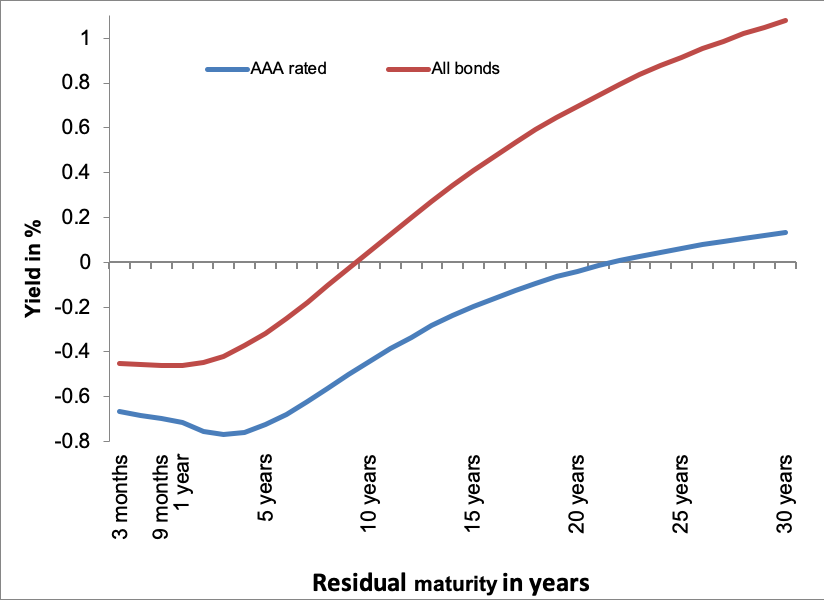
  1. Quantitative easing (QE). This toolinvolves large-scale purchases of longer-term bonds by the ECB with the aim of easing monetary and financial conditions in order to boost spending. Purchases of government bonds increase their asset prices and consequently lower their respective yields. Asset prices and yields are influenced through two channels, namely the portfolio balance and the signaling channels. The first postulates–given that assets are imperfect substitutes–that purchases of longer-term government assets can also decrease the yields of other assets bearing similar credit risk and duration characteristics. In other words, the sellers of these bonds will seek to rebalance their portfolios by buying other assets that are substitutes for the ones that they have sold. This process will raise the price of other assets (wealth effect) and decrease their yields (lowering borrowing costs for firms and households as well as governments) an action that stimulates spending and investment. The signaling channel operates through the effect on expected future policy rates and can reduce the inflation expectations component (term premia) of long-term interest rates. In this respect, the QE measure is complementary to forward guidance, supporting the ECB’s commitment to stick with the announced accommodative policy. QE seems to have become a key instrument of monetary policy in the euro area which will embark again on asset buying on November 1 at a monthly rate of € 20 billion.  Based on the forward guidance rhetoric, QE is intended to last for quite some time and go beyond the €2.6 trillion bond-buying program that was first implemented and lasted through the end of 2018. But such actions are not harmless. QE could distress market conditions by diminishing the supply of long-term bonds in the market, and create a shortage of bonds that institutional investors and others used as collateral.

Figure 3. Yield curve in the euro area as of September 12, 2019
Source: ECB
  1. Targeted, Longer-Term, Refinancing Operations (TLTRO). TLTROs are monetary policy tools that provide long-term loans to banks. The aim is to provide a favorable bank credit environment, enhancing support for financing the real economy. It will also ensure the smooth functioning of the bank lending channel as the main monetary policy transmission mechanism. According to the new TLTRO, banks can borrow up to 30% of their outstanding loans to businesses and consumers at a rate equal to main refinancing operation rate (0%). In cases where a bank sufficiently improves its lending to the real economy, the interest rate applied could become negative up to the deposit rate (-0.5%).

Discussion

The ECB’s announced measures aim to revive inflation expectations and bring inflation close to its 2 percent target level, something the ECB has fallen short of since 2013 and raised concerns about its credibility. In addition, the new monetary measures can spur economic growth by lowering longer-term borrowing costs for firms and households, and by providing an opportunity for Euro area member states to finance a fiscal expansion with very favorable interest rates.

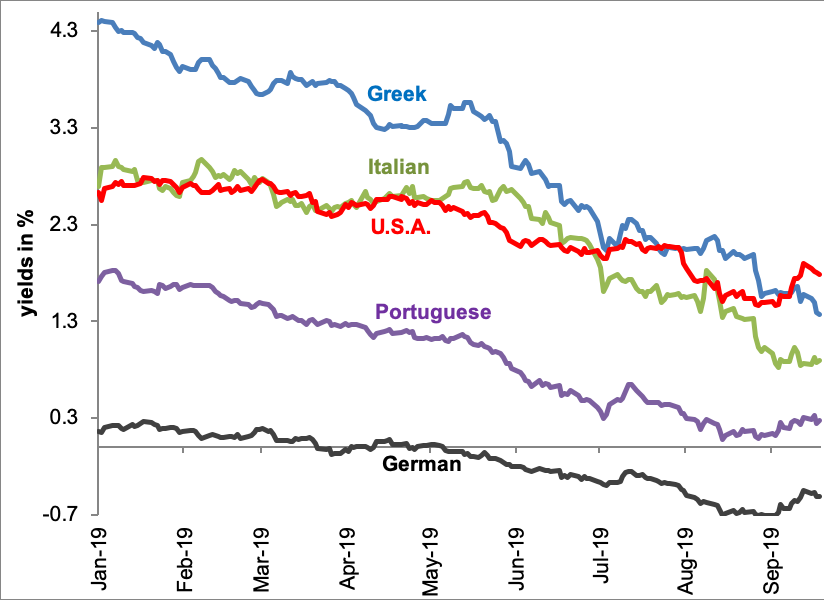
On the adverse side effects of the unconventional measures, this ample liquidity handed to the banking system could easily be simply deposited with the ECB, or invested in higher-risk and higher-yield assets offered. To a certain degree, the downward movement of long-term yields in parts of the euro area, shown in Figure 4, is a testament to “hunt for yield.” By now the Greek 10-year bond yield, a non-investment grade asset is lower than the corresponding AA+ U.S. Treasury. As negative rates narrow banks’ margins, financial institutions could decrease lending and slow the economy. Core banks from Germany, France and Benelux, which account for 85% of excess liquidity, bear the bulk of the cost of these negative rates.

Figure 4. 10-year bond yields of selected countries
Source: Federal Reserve Economic Data (FRED) and Central Banks’ sites

What does the future hold? It is evident that the significant accommodative stance of monetary policy is set for a long time. Although the unconventional measures are mutually reinforcing, monetary policy alone might not be sufficient to revive growth in the euro area. The ECB has willingly passed on the growth baton to the member states, though most have applied austerity measures throughout the crisis and now seem reluctant to conduct a vital, expansionary, fiscal policy.

Unconventional Monetary Policies Become Conventional After All?2019-11-05T15:31:41+00:00

Trump’s Trade Quagmire

Paul Krugman
August 30, 2019

Remember the Vietnam quagmire? In political discourse, “quagmire” has come to have a quite specific meaning. It’s what happens when a government has committed itself to a policy that isn’t working but can’t bring itself to admit failure and cut its losses. So, it just keeps escalating, and things keep getting worse.

Well, here’s my thought: Trump’s trade war is looking more and more like a classic policy quagmire. It’s not working — that is, it isn’t at all delivering the results Trump wants. But he’s even less willing than the average politician to admit to a mistake, so he keeps doing even more of what’s not working. And if you extrapolate based on that insight, the implications for the U.S. and world economies are starting to get pretty scary.

To preview, I’m going to make five points:

  1. The trade war is getting big. Tariffs on Chinese goods are back to levels we associate with pre-1930s protectionism. And the trade war is reaching the point where it becomes a significant drag on the U.S. economy.
  2. Nonetheless, the trade war is failing in its goals, at least as Trump sees them: the Chinese aren’t crying uncle, and the trade deficit is rising, not falling.
  3. The Fed probably can’t offset the harm the trade war is doing and is probably getting less willing even to try.
  4. Trump is likely to respond to his disappointments by escalating, with tariffs on more stuff and more countries, and — despite denials — in the end, with currency intervention.
  5. Other countries will retaliate, and this will get very ugly, very fast.

I could, of course, be wrong. But that’s how it looks given what we know now.

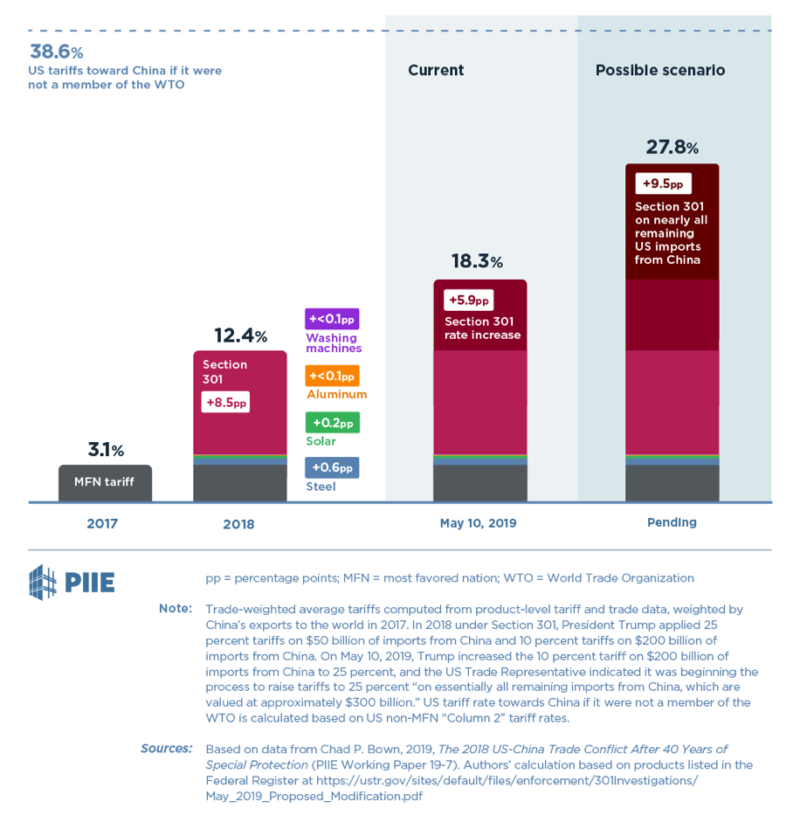
Let’s start with the scale of the policy. The Peterson Institute for International Economics (PIIE) generated a nice chart showing the escalation of tariffs on Chinese goods under Trump:

Average US tariff rates on imports from China before and after President Trump’s acts of protection

Source: PIIE

So roughly speaking, we’ve seen a 20 percent tax imposed on the $500 billion worth of goods we import from China each year. Although Trump keeps insisting that the Chinese are paying that tax, they aren’t. When you compare what has happened to prices of imports subject to new tariffs with those of other imports, it’s overwhelmingly clear that the burden is falling on U.S. businesses and consumers.

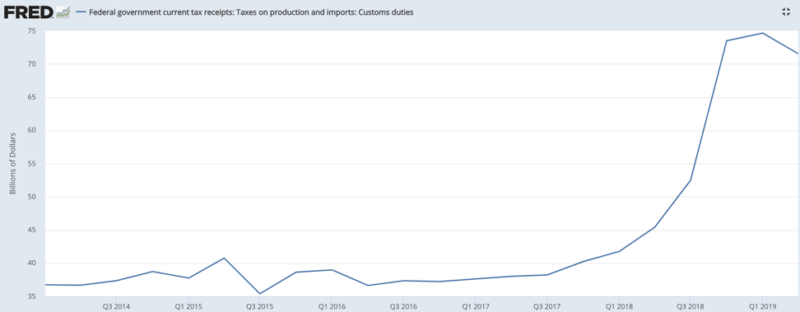
So that’s a $100 billion a year tax hike. However, we aren’t collecting nearly that much in extra tariff revenue: 

Customs duties receipts (in billions of Dollars)

Source: Federal Reserve Bank of St. Louis


Partly that’s because the revenue numbers don’t yet include the full range of Trump tariffs. But it’s also because one big effect of the Trump tariffs on China has been to shift the sourcing of U.S. imports — e.g., instead of importing from China, we buy stuff from higher-cost sources like Vietnam. When this “trade diversion” happens, it’s still a de facto tax increase on U.S. consumers, who are paying more, but it doesn’t even have the benefit of generating new revenue.

So, this is a pretty big tax hike, which amounts to contractionary fiscal policy. And we should add in two other effects: foreign retaliation, which hurts U.S. exports, and uncertainty: Why build a new factory when for all you know Trump will suddenly decide to cut off your market, your supply chain, or both?

I don’t think it’s outlandish to suggest that the overall anti-stimulus from the Trump tariffs is comparable in scale to the stimulus from his tax cut, which largely went to corporations that just used the money to buy back their own stock. And that stimulus is behind us, while the drag from his trade war is just getting started.

But why is Trump doing this? A lot of center-right apologists for Trump used to claim that he wasn’t really fixated on bilateral trade balances, which every economist knows is stupid, that it was really about intellectual property or something. I’m not hearing that much anymore; it’s increasingly clear that he is, indeed, fixated on trade balances, and believes that America runs trade deficits because other countries don’t play fair.

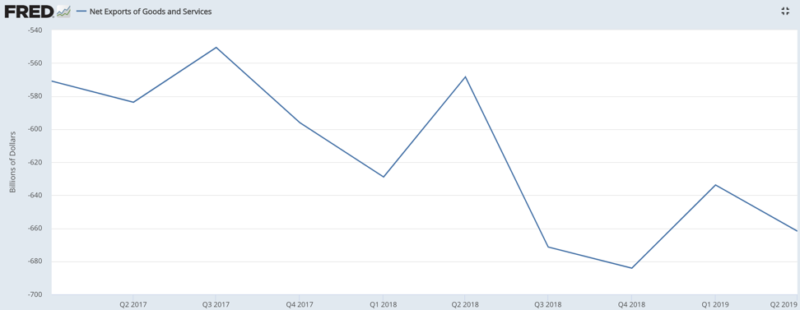
Strange to say, however, despite all those new tariffs the U.S. trade deficit is getting bigger, not smaller, on his watch:

US net exports of goods and services (in billions of dollars)

Source: Federal Reserve Bank of St. Louis


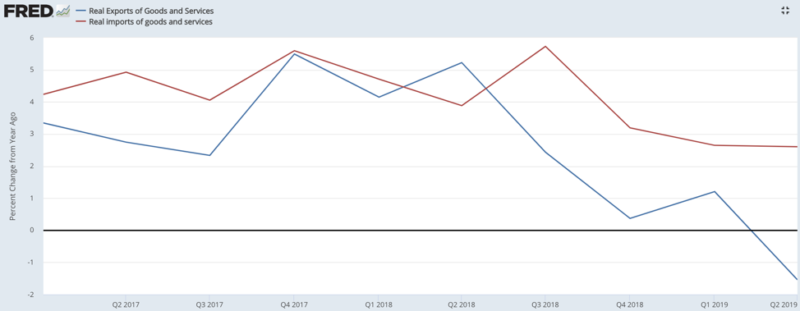
Adjusted for inflation, imports are still growing strongly, while U.S. exports have been shriveling:

Year-over-year percentage change in real (inflation-adjusted) exports and imports of goods and services

Source: Federal Reserve Bank of St. Louis

Why aren’t tariffs shrinking the trade deficit? Mainly the answer is that Trump’s theory of the case is all wrong. Trade balances are mainly about macroeconomics, not tariff policy. In particular, the persistent weakness of the Japanese and European economies, probably mainly the result of shrinking prime-age work forces, keeps the yen and the euro low and makes the U.S. less competitive.

When it comes to recent import and export trends, there may also be an asymmetric effect of the tariffs themselves. As I already mentioned, U.S. tariffs on Chinese goods don’t do much to reduce overall imports, because we just shift to products from other Asian economies. On the other hand, when the Chinese stop buying our soybeans, there aren’t any major alternative markets.

Whatever the explanation, Trump’s tariffs aren’t producing the results he wanted. Nor are they getting the other thing he wants: Splashy concessions from China that he can portray as victories (“tweetable deliveries”). As Gavyn Davies says, China seems “increasingly confident it can weather the trade wars,” and it’s not showing any urge to placate the U.S.

So, this might seem to be a good time to hit the pause button and rethink strategy. Instead, however, Trump went ahead and slapped on a new round of tariffs. Why?

Well, stock traders reportedly think that Trump was emboldened by the Fed’s rate cut, which he imagines means that the Fed will insulate the U.S. economy from any adverse effects of his trade war. We have no way of knowing if that’s true. However, if Trump does think that, he’s almost surely wrong.

For one thing, the Fed probably doesn’t have much traction: interest rates are already very low. And the sector most influenced by interest rates, housing, hasn’t shown much response to what is already a sharp drop in mortgage rates.

Furthermore, the Fed itself must be wondering if its rate cut was seen by Trump as an implicit promise to underwrite his trade war, which will make it less willing to do more — a novel form of moral hazard.

There is, by the way, a strong contrast here with China, which for all its problems retains the ability to pursue coordinated monetary and fiscal stimulus to a degree unimaginable. Trump probably can’t bully the Fed into offsetting the damage he’s inflicting (and just try to imagine him getting Nancy Pelosi to bail him out); Xi is in a position to do whatever it takes.

So, what will Trump do next? My guess is that instead of rethinking, he’ll escalate, which he can do on several fronts. He can push those China tariffs even higher. He can try to deal with trade diversion by expanding the trade war to include more countries (good morning, Vietnam!).

And he can sell dollars on foreign exchange markets, in an attempt to depreciate our currency. The Fed would actually carry out the intervention, but currency policy is normally up to the Treasury Department, and in June Jerome Powell reiterated that this is still the Fed’s view. So, we might well see a unilateral decision by Trump to attempt to weaken the dollar.

But a deliberate attempt to weaken the dollar, gaining competitive advantage at a time when other economies are struggling, would be widely — and correctly — seen as beggar-thy-neighbor “currency war.” It would lead to widespread retaliation, even though it would also probably be ineffective. And the U.S. would have forfeited whatever remaining claims it may still have to being a benevolent global hegemon.

A version of this article has been originally published in New York Times on 3/08/2019

Trump’s Trade Quagmire2019-08-31T00:02:55+00:00

U.S. – China Trade Conflict: Impacts on China

Zhuo Xi
July 23, 2019

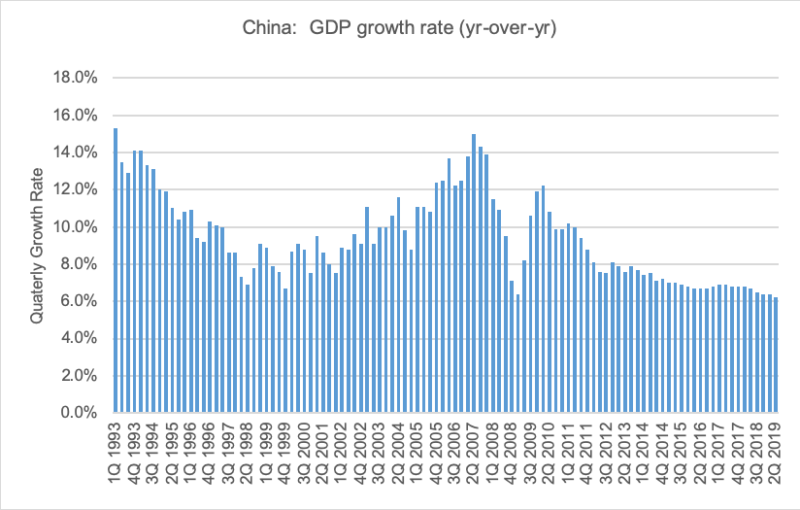
Starting from the different positions held by the Trump administration and the Chinese government on issues such as the bilateral trade balance, market access, and intellectual property transfers, China and the U.S., the world’s two largest economies, have been quarreling over trade for more than a year. This post reviews a number of measures of the recent performance of China’s economy to see if there have been any discernible impacts to date. The United States has initiated two rounds of tariffs on Chinese goods. In July of last year, 25% tariffs were placed on $50 billion of U.S. imports; in May of this year, a second-round raised tariffs from 10% to 25% on $200 billion of U.S. imports. President Trump has repeatedly warned that the United States may also place tariffs on another $300 billion in Chinese goods. China has responded with tariffs on $60 billion of U.S. goods after the May tariff hike. While tariffs have affected China’s trade, and investors are worried about the possible fallout that could hit companies, whole sectors, and other countries caught in the crossfire, the actual macroeconomic implications for China appear limited so far.

Direct Impacts

Source: OECD

According to recent data, China’s GDP has slowed to 6.3% year on year in the first half of 2019 (see above figure) feeling the pinch from the tariffs imposed. However, this view ignores that ongoingde-leveraging, real estate-regulation, and environmental protection have also caused significant downward pressure on China’s economy. In fact, China’s exports surged in 2018 a move that might be related to thefront-loading impactas exporters pushed out shipments ahead of the implementation of the latest tariffs, backed also by a weaker Chinese currency against the U.S. dollar. But, it’s uncertain whether the recent resilience of exports is likely to be sustained, especially considering that the higher tariffs on $200 billion worth of Chinese goods will soon take effect. In fact, both the World Bank and the International Monetary Fund (IMF) have lowered their forecasts for China’s future GDP growth.

Source: World Bank

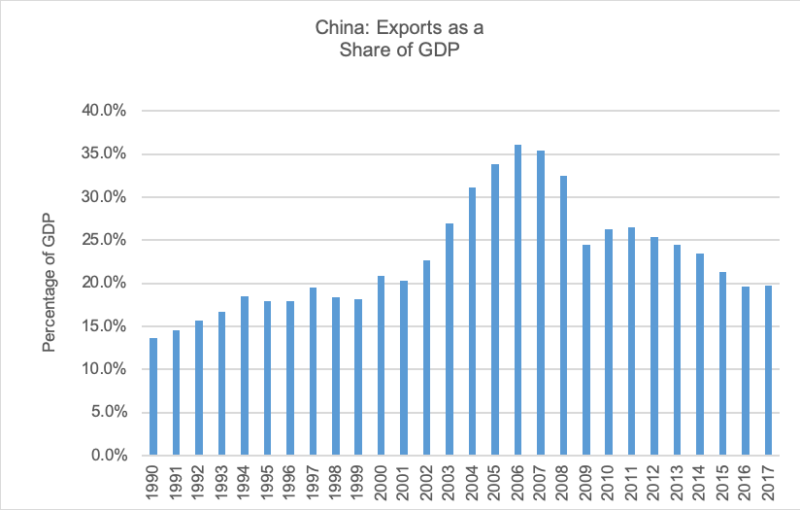
Although the trade war between the two countries threatens to become much worse in the future, the direct impact on GDP is still limited in the long- term, since China’s economy is no longer mainly driven by exports. According to the data from the World Bank (above figure), exports accounted for roughly 20% of China’s GDP in 2017, down from 36% in 2006. Also, bilateral trade between the two countries contributes an even smaller amount to GDP. For China, U.S. trade contributes 2.5% to GDP while only 1% for the U.S.

Currency valuation

Source: FRED

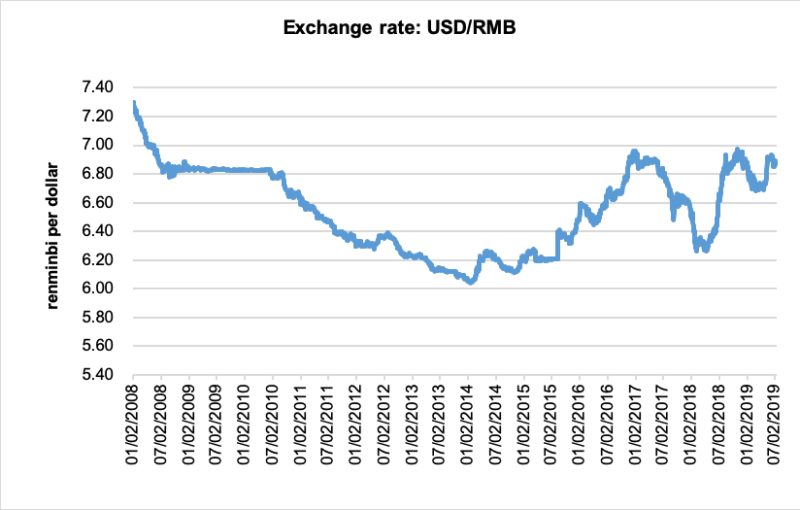
Since China’s trade dispute with the United States, China has seen its currency, the renminbi (RMB), decline in value. Although the decline has not been as steep as that of the Turkish lira or the Argentine peso, whether China will also fall into a similar monetary crisis has been an important question for investors. Although the RMB is depreciating, one difference is that China has responded to the trade situation by allowing a moderate and controllable RMB depreciation. Generally, the policy has been to intervene and stabilize the value of RMB within the range (band) of 6 and 7 per US dollar. This should help Chinese exporters mitigate the impact of new tariffs, but it will cost the rest of the economy. In other words, contrary to other emerging market, the depreciation of the exchange rate is more intentional and controllable by the government.

The reason behind this trend is that China’s economic base and ability to control the exchange rates are hard to match in other emerging market countries. This point could be reflected by the recent variation of USD/RMB, where there was clear support when the rate approached 7. On the other hand, various Chinese financial governors have mentioned several times in the media that China won’t use devaluation as a tool in the trade dispute. The possible reason is that the internationalization of the RMB has been one of the top goals for Chinese financial development. In fact, the People’s Bank of China has just managed to successfully convert the one-way renminbi devaluation expectation of the market into the two-way currency fluctuation expectation in recent years. Based on these two considerations, a rapid depreciation of the RMB is not likely in the near future. However, if the trade conflict between the US and China has escalated to a financial war, then the possibility of strong depreciation cannot be ruled out.

Debt condition

There is a widespread view that an escalation of the tariff conflict could trigger a possible debt crisis in China and an increase of debt-to-GDP ratio due to deceleration of the GDP growth rate. But unlike the case of Turkey (and even Argentina’s), where the external debt position was almost 55% of GDP, equivalent to about 5.4 times the level of its foreign exchange reserves, China’s debt is mainly domestically held, while the external part is considered sustainable. Furthermore, China holds considerable USD exchange reserves-one third in the form of US Government securities-and given the slowly opening of its capital markets it can decisively control any capital outflow.

Impact on the Stock Market

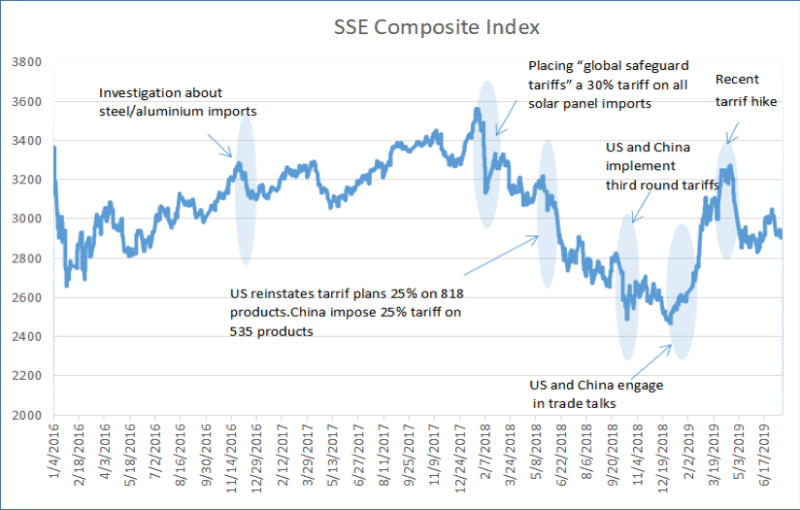
The stock market is probably the place that will face the greatest impact. Global investors are worried about the continuous escalation of the US-China trade war. Since the beginning of 2018, China’s stock market has gradually fallen. At the end of the last year, the Shanghai Composite Index (SSE) once fell below 2,500, and the year-to-date decline was close to 30%. The trade dispute between the US and China had been one of the main causes for investor pessimism. To prevent a possible market crash, the top officials of the Chinese Government collectively called for stable expectations. In addition to the optimism over the prospect of a possible deal, the stock market bounced back in early 2019. However, immediately after President Trump increased tariffs on $200 billion worth of Chinese goods, the stock market has fallen sharply below 3,000 again.

Source: Yahoo Finance

Other Potential Impacts

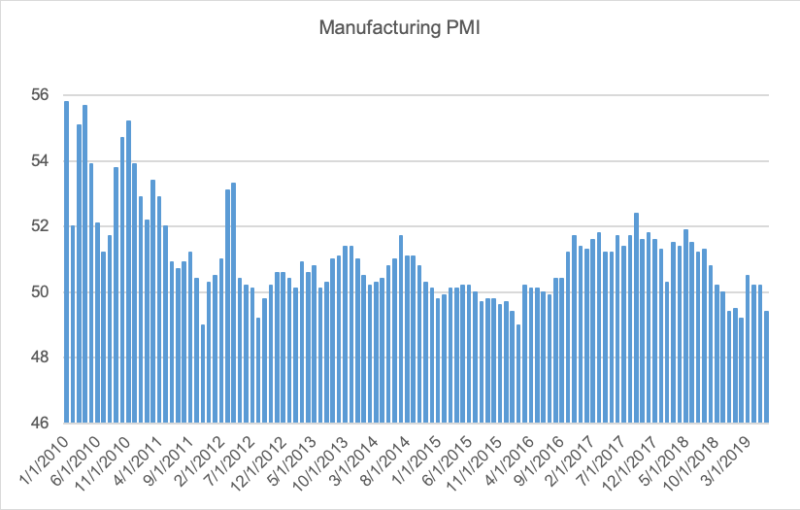
In addition to the declining stock market, the impact of Sino-US trade frictions on China’s economy is gradually moving from the expected and psychological levels to the physical level, from local to global, including trade, investment, the supply chain, employmentand so on. For instance, the impact on the industrial chain cannot be underestimated; such effects are difficult to model quantitatively. For example, due to concerns about the uncertain future of the Sino-US trade war, more and more multinational companies are hesitant about continued investment in China and are gradually adjusting their global profile. According to survey reports, in order to avoid high import tariffs in the United States, large Japanese manufacturers have been re-examining their business strategy and have plans to transfer production lines out of China. The effects of the concern regarding a U.S.-China trade war can be reflected in the recent variation in the manufacturing PMI (Purchasing Managers Index): the PMI had declined to an annual low of 49.2 since the trade dispute. It rebounded back above 50 in recent months due optimism over a possible deal, but it fell again to 49.4 due to recent tariff hike.

The Purchasing Managers’ Index (PMI) is based on a monthly survey of supply chain managers across 19 industries, covering both upstream and downstream activity. The headline PMI is a number from 0 to 100. A PMI above 50 represents an expansion when compared with the previous month. A PMI reading under 50 represents a contraction, and a reading at 50 indicates no change.
Source: The National Bureau of Statistics

The future of the US-China relationship will be essential not only for their wellbeing but for the global economy. Recent news surrounding Huawei and other Chinese tech companies suggests that the bilateral tensions between the two countries have expanded beyond the damaging trade war, and are headed for a keen rivalry in technology and innovations. With the APEC (12-member Asia Pacific Economic Cooperation) meeting in November, it’s possible for the U.S. and China to reach a “narrow” trade deal by the end of this year, but by no means to resolve all the tensions between the two countries. In the long- term, geopolitical experts have been warning that China and the US appear to be falling into the “Thucydides Trap”, which describes a situationin which a war between two countries is inevitable even though both nations may be trying their best to avoid it.

U.S. – China Trade Conflict: Impacts on China2019-07-25T21:11:48+00:00

The Sword of Damocles (Part II): The Precariousness of the Greek Banking System during the Great Sovereign Debt Crisis

Fotios Siokis
March 04, 2019

Part II

With the collapse of Lehman Brothers in September 2008 and the transmission of the crisis to world financial markets, financial liquidity started to drain and investors’ confidence began to deteriorate. Central banks around the globe initiated unprecedented expansions of their liquidity facilities aimed at preventing the collapse of their banking systems and their economies.

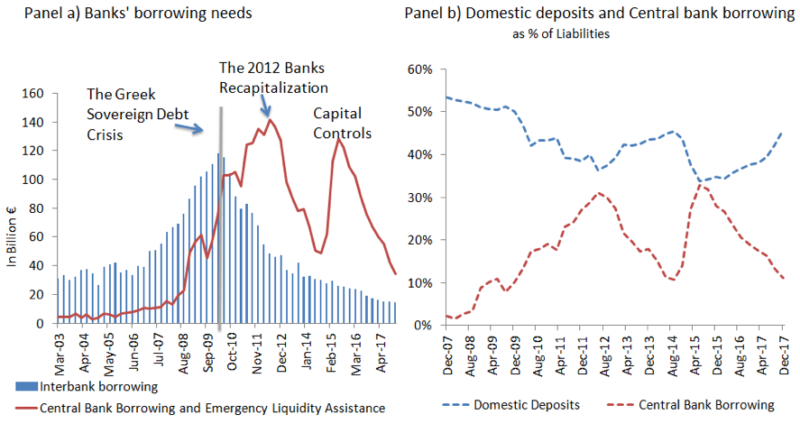
The Greek banking system found itself at the epicenter of a great sovereign debt crisis, trapped in a vicious cycle, exacerbated by a deep and prolonged recession that lasted nearly eight years. The sharp disruption in financial intermediation and the threat to bank solvency forced the authorities to bail out the more important banks. Throughout the crisis, the financial authorities responded numerous times to the liquidity strain by injecting Euro-system funds (figure 1, panel a). From August 2011, the European Central Bank authorized a special credit line to the Greek banking system, called the Emergency Liquidity Assistance, upon which the banks depended heavily, especially during periods of deposit withdrawals. In June 2012, after the restructuring of sovereign debt, European Central Bank funding amounted to around 136 billion euro and came almost exclusively in the form of Emergency Liquidity Assistance. The final resort to this expensive source of funds took place in May 2015, as deposits again dropped substantially when negotiations between the newly elected government and its creditors had stalled (figure 1, panel b). Alongside the provision of liquidity, the authorities initiated three rounds of successive capitalizations for the banking system, with large capital injections equal to about 43 billion euros.

Figure 1. Banks’ borrowing needs and Domestic deposits

Source: Bank of Greece

Attempts at reviving credit growth in the Greek Economy

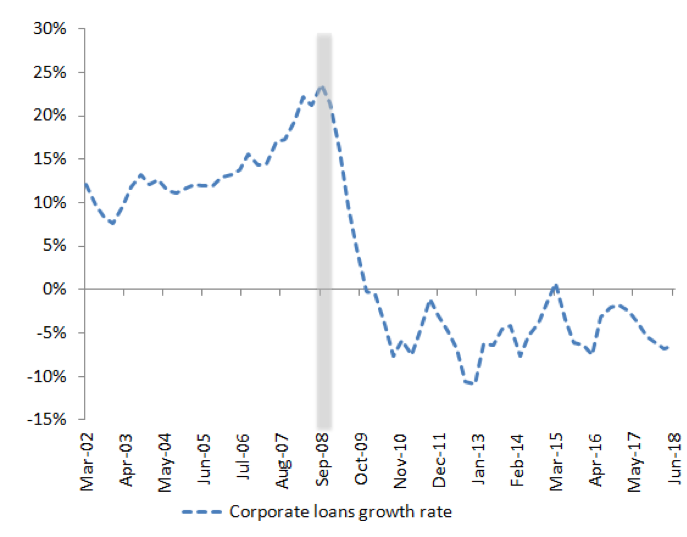
The tightened lending conditions had severe consequences for the majority of credit-dependent, small-to-medium enterprises, and thus for the Greek economy as a whole. The critical significance of small-to-medium enterprises is documented in the survey regularly conducted by the ECB, which reveals that they contribute roughly 70.2% of the total value-added while accounting for 70.6% of banks’ lending. By contrast, the percentages for the small-to-medium enterprises in the euro-area are 49.9% and 58.1%, respectively. The credit asphyxia became apparent in late 2010 when banks stopped providing loans to corporations and households. According to the following graph, the credit contraction began in November 2008, as the global financial crisis spread to the European Union. Prior to 2008, and with Greece’s entry to euro-area, banks were provided with access to low-cost credit and to ample liquidity. The banks embraced retail and corporate lending, which entailed excessive leverage. Mortgage loans rose by an average of 30% year-on-year, topping all other euro-area countries, while consumer loans increased by 28% over the same time period.

Figure 2. Corporate lending activity ( year over year %)

Source: Bank of Greece

Despite all above efforts and with an improved Banks Capital Adequacy Ratio to 18%, compared to an average of 16.7% for the main banks in the euro-area, Greek banks remained still unable to finance the economy. Loans to households are receding while credit to corporations is stagnating (figure 2). The failing attempts of reviving credit growth is attributed to the large stock of non-performing loans (NPLs) held by banks on their balance sheet. A high NPL ratio, or the percentage of the value of total loans that are non-performing as a share of total loans, requires banks to put more capital aside thus reducing credit availability. In addition, banks with a high NPL stock become more risk-averse and cautious in their lending and tend to focus mainly on improving asset quality.

The Non-Performing Loans Issue

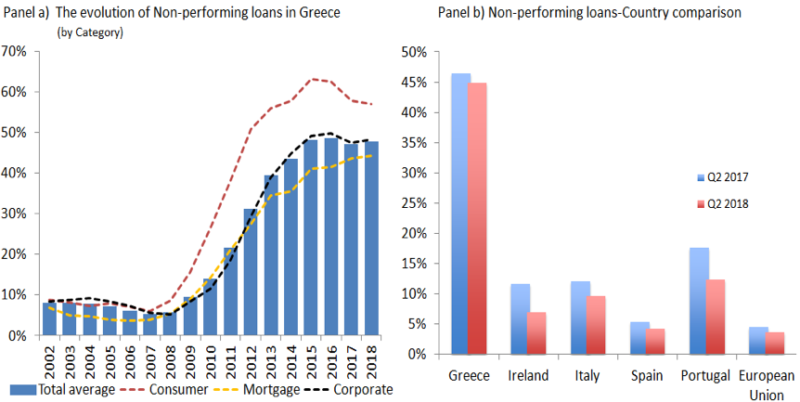
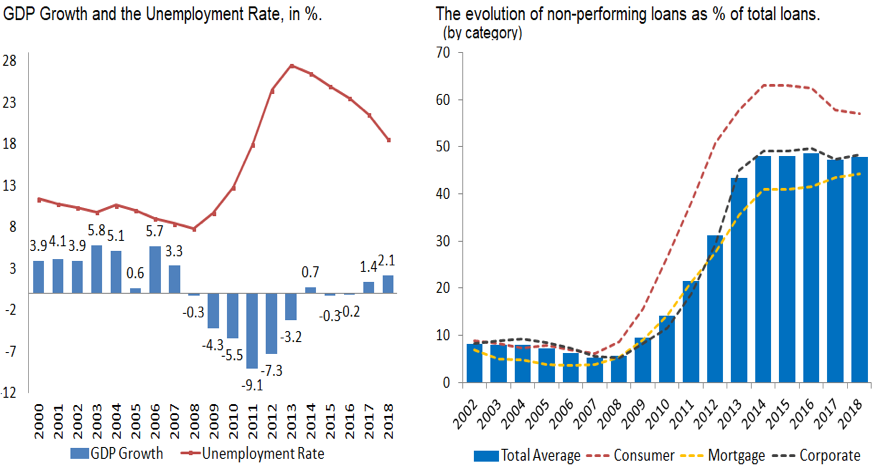
The NPLs ratio rose from 4.6% in 2007 to 9.1% in 2010 and to 31.9% in 2013 before surging to 47.5% in 2016 (figure 3, panel a). As of the second quarter of 2018, NPLs NPL stood at 45.5% of total loans, the largest percentage by far within the Euro-area (figure 3, panel b). It is now common knowledge that the accumulation of NPLs on their balance sheets explains why the banks have been unable to support any resumption of credit expansion and thus economic growth.

Figure 3. Non-performing loans as % of total gross loans

Source: Bank of Greece and European Central Bank

The severity of the depression had led to the NPLs rise to this extraordinary level. Contributing to this increase were problematic corporate governance practices with poor management and inadequate assessment of credit risks.  Loans granted in the pre-crisis period to political parties and to corporations with low creditworthiness but privileged relationships with banks are a notable example. Reform of corporate governance practice was, in fact, raised as a precondition for the 2015 capitalization. Based on the “fit and proper” criterion, most board members of the banks were evaluated and some replaced to ensure the safety and soundness of the banks on boards they served.

Also, an important dimension of the NPLs problem lies in the existence of a significant percentage of borrowers who have the capacity of servicing their loans but have decided not to do so, hoping for a future major hair-cut of their loans. The so-called strategic or willful defaulters, differed from the distressed defaulters are taking advantage of debtor protection program and of the absence of any consequences. They comprise around one-fourth of the total NPLs.

Conclusion and Lessons Learned from the Sovereign Crisis

The sovereign debt crisis revealed a strong negative feedback loop between the government and the domestic banking system. Banks supported Greek sovereign bond prices by accumulating Greek government bonds during the crisis, while the government provided guarantees and bailout funds. The resultant fiscal costs and lack of lending opportunities to corporations, which increased sovereign distress even further, should raise serious concerns regarding this relationship.

The sovereign debt crisis placed the banking sector in a very vulnerable position, threatened by insolvency and poor loan performance. High credit growth along with the excessive risk-taking for loans granted to entities with minimal creditworthiness and the great reliance on accumulated domestic sovereign bonds remain key issues. After the recent experience, the European Central Bank has put a ceiling in domestic government bonds accumulation.

In conclusion, the Greek economy needs higher and sustained growth. Restoring full confidence in the financial system and reviving bank lending, especially to corporations, is paramount. But the large percentage of NPLs stands in the way, limiting the ability of the banks to support economic growth. They need to clear the bad loans off their balance sheets. Otherwise, as the International Monetary Fund has recently announced, banks will continue to need fresh capital injections in a vicious cycle seemingly without end.

The Sword of Damocles (Part II): The Precariousness of the Greek Banking System during the Great Sovereign Debt Crisis2019-03-04T21:46:47+00:00

The Sword of Damocles (Part I): The Precariousness of the Greek Banking System During the Great Sovereign Debt Crisis

Fotios Siokis
February 19, 2019

Part I

The Greek economy appears finally to have turned the corner with the Government’s announcement, in August 2018, that the country has exited its third bailout package. This article examines the role of banks in the recovery and the debt crisis.

Economic activity has registered positive growth for two consecutive years and seems to be on track to maintain that growth, albeit at just under 2%, for the next two years. As the government proceeds without a new line of credit from its creditors, Greek banks seem incapable of contributing to any further economic expansion. They remain vulnerable, still burdened by the gigantic number of the non-performing loans (NPLs) and therefore poorly positioned to finance new investment. The NPL ratio, now close to 45% of total loans, greatly undermines the banks’ ability to lend to the private sector.

In this context, we attempt to answer the question: why did the Greek banks get into such trouble? A series of two parts, which are closely related helps to explain how, the banking system evolved during the sovereign crisis. The first part deals with the impact of the crisis to the banking system, and the efforts made by the authorities to keep the banking system solvent. The second part deals with banks’ lending activities and the rise of the non-performing loans. We conclude with some lessons learned from the crisis.

The Acute Face of the Sovereign Crisis

The Greek banking system found itself at the epicenter of a great sovereign debt crisis and the attendant austerity program. It became trapped in a vicious cycle, which was exacerbated by a deep and prolonged recession that lasted nearly eight years. Unlike recent experiences in Ireland, and to a lesser extent Spain and Italy, the undercapitalization of the Greek banking system in 2012 was the result of the Greek sovereign debt crisis and, to a lesser extent, the unrestrained growth of lending following Greece’s entry into the euro-area.

The sovereign debt crisis emerged after the announcement by EU (European Union) authorities in 2010 that the Greek budget deficit for 2009 was 15.6% of GDP, four times higher than reported by the previous government, while measures of the public debt were revised sharply upwards to 126.7% of GDP. Once fiscal consolidation efforts took center stage, unprecedented public spending cuts and sizeable tax increases, along with the weakness of the euro-area economy, led to a reduction in output by about 28% through 2013 and a rise in the unemployment rate to a staggering 27.8%. As the country moved into the heart of the crisis, the deep recession and the austerity measures implemented by successive governments caused a number of corporations and households to default on their loans. As we discuss in part II of this series, the NPL ratio rose sharply and remains elevated.

Source: Eurostat and Bank of Greece

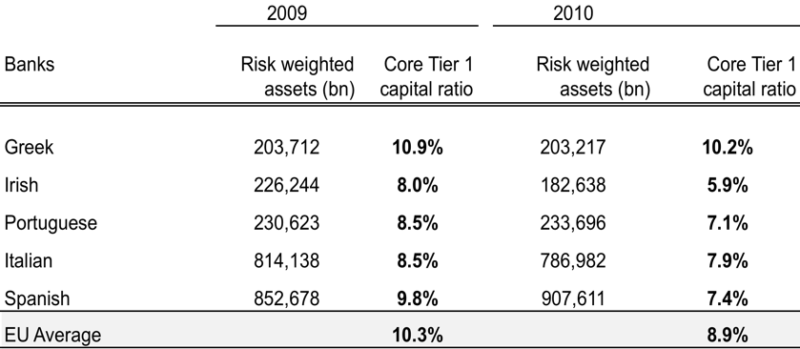
Up until 2010, the Greek banking system was regarded as sound thanks to its limited exposure to “toxic financial instruments” and its strong capital base which, coupled with steady support from the Bank of Greece (BoG) and the ECB, ensured stability of the Greek banking system during the first two years of the world financial crisis.

Table 1. Risk-weighted Assets and Core Capital for Selected Banking Systems
Source: European Banking Authority, stress tests as of 2010, participating banks

However, Greek banks were hit hard, as the uncertain value of sovereign debt and defaults spawned a series of downgrades of Greek debt and led to the first run on the banks. From December 2009 to end of 2011, households and corporations withdrew vast sums from the banks and deposits fell by more than 25%. The pressure on liquidity escalated further as successive downgrades of Greek bond ratings resulted in a higher cost of banks’ borrowing in wholesale and interbank markets.

The sovereign-bank nexus and the domestic bias

In early 2012, the banks brought to their knees, when the biggest sovereign-debt restructuring process in modern history took place. The orderly debt exchange of old bonds for new ones with longer maturities, known as Private Sector Involvement (PSI), entailed a 53.3% haircut on the nominal value of old bonds. In light of their large exposure to Greek government bonds , the banks took a huge loss of about 38 billion euros. They suffered bankruptcy with the depletion of their equity capital.
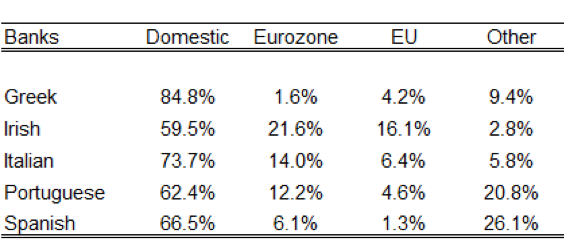
The PSI was especially costly to Greek banks as it followed on the heavy exposure to sovereign risk that developed as banks had added considerably to their holdings of government bonds, particularly between 2009-2011. Despite the evidence that substantial cross-border sovereign bond investment among member states of the Euro-zone facilitated financial integration, a “domestic bias” persisted strongly in some countries, especially in Greece. At the end of 2010, banks held in their investment portfolio a much greater portion of domestic sovereign debt compared to other countries facing similar circumstances. (Table 2).

Table 2. Sovereign Debt held by BanksSource: European Banking Authority, stress tests as of 2010, participating banks

Large holding of domestic sovereign bonds, which are regarded as risk-free within the regulatory framework, provide the collateral needed to access liquidity from interbank markets and the Central Bank. At the same time, excessive holdings of domestic sovereign debt imply that, in times of crisis when sovereign risk increases – as in the case of Greece – access to wholesale funds and deposits (liquidity) can suddenly disappear. The composition of banks’ funding must then shift to an increasing reliance on Central Bank liquidity. Negative effects on the real economy follow from the transmission of credit-risk associated with sovereign debt to lending and investment activities in the private sector. An interesting question is why Greek banks at that time relied so heavily on domestic government bonds, knowing that every deterioration in sovereign creditworthiness reduces the market value of their domestic sovereign debt portfolio.

Bank Capitalizations and the Restructuring Phase

The sharp disruption in financial intermediation and the threat to bank solvency forced the authorities to bail out the more important banks. Stress tests concluded that necessary re-capitalization amounted to 28.6 billion euros. A newly created Hellenic Financial Stability Fund financed 25 billion euros, about 90% of the total, while the rest came from the private sector. The share capital increase was completed in June 2013. A puzzling aspect of this episode concerns the fact that the authorities knew the banks had to be recapitalized because of the forced reduction in the nominal price of government bonds. Why, then, didn’t they leave the banks out of the PSI? Probably, the answer lies in the fact that the banks held a huge amount of the sovereign debt, and by excluding them, it would have compromised the outcomes of the debt-restructuring attempt.

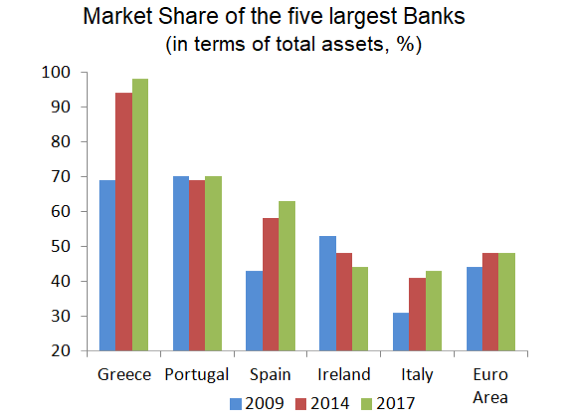
In an effort to strengthen the financial system and restore public confidence, the financial authorities proceeded with an extensive restructuring and consolidation program for the Greek banking system, reducing capacity in the industry through mergers and takeovers and the liquidation of a number of commercial and cooperative banks. By 2014 the banking system recorded the largest decrease in the number of banks among the euro-area systems, and the new roadmap comprised only four major-systemic banks, commanding more than 94% of the total market share in terms of assets.

Source: European Central Bank

Another important recapitalization of domestic banks took place at the end of 2015. Following early elections in January 2015, the breakdown of the prolonged negotiations with creditors (from late 2014-June 2015) triggered a major bank-run, amounting to almost 42 billion euros. The Bank of Greece imposed a bank holiday in late June 2015, followed by capital controls. These dire events induced European authorities to orchestrate another recapitalization, equal to 14.4 billion euros. Roughly 10 billion euros was covered by the private sector and the remainder by the financial stability fund. This created a new shareholder landscape as the participation of the fund in previous recapitalizations was heavily diluted. Most of the shares were sold to private investors for a fraction of their nominal prices.

The recapitalization was finalized at the end of 2015, before the introduction of the EU Bank Recovery and Resolution Directive which called for a bail-in solution with a haircut on all unsecured deposits in excess of 100,000 euros. Since most of the large depositors had already withdrawn their funds from the banking system, the remaining deposits were mainly the working capital of small-to-medium enterprises. A haircut on their working capital would have further hurt the economy and put their existence at risk. But although the recapitalization improved the Banks Capital Adequacy Ratio to 18%, compared to an average of 16.7% for the main banks in the euro- area, Greek banks still remained unable to finance the economy. We explore the reasons for this in Part II of this series.

The Sword of Damocles (Part I): The Precariousness of the Greek Banking System During the Great Sovereign Debt Crisis2019-03-04T20:36:32+00:00

Argentina’s Latest Crisis

Meng-Ting Chen and Joseph van der Naald
November 16, 2018

Following a stunning fall in the value of its peso, a total loss of nearly 50% for 2018, and interest rates hitting 60%, Argentina’s economy appeared to be facing the strong likelihood of a crisis. While the government responded by taking a number of measures to calm the markets for the time being, the roots of Argentina’s crisis are complex. In this article, we outline the economic precursors to the Argentinian financial crisis and examine the steps being taken to address the situation. The country recently accepted a $57.1 billion bailout from the International Monetary Fund (IMF), temporarily stabilizing the situation. The administration of President Mauricio Macri has agreed to economic reforms, including spending cuts of 1.4% and revenue increases of 1.2% of GDP. The Central Bank is also keeping the nominal money supply constant with the objective of slowing inflation.

Though Argentina’s adjustments have partially restored investor confidence, the future remains uncertain. Emergency funds from the IMF signal confidence in Argentina, and yet both the Fund and Moody’s is predicting a considerable contraction in the economy in the coming year. Further, rising interest rates in the United States threaten Argentina’s situation as dollar-denominated debt becomes harder to repay. This crisis has been characterized as the potential beginnings of a “textbook” emerging-market crisis, caused by considerable short-term external debt in tandem with a budget deficit, and a current-account deficit.

The Genesis of the Crisis

Argentina’s current crisis has its roots in economic policies of crises past. During the four-year Argentine Great Depression of 1998 to 2002, the peso was pegged to the US dollar and the Argentine government imposed a set of capital controls known as “el corralito,” restricting bank account activity and prohibiting withdrawals from U.S. dollar-denominated accounts. With the official rate fixed and currency exchange restricted, these controls contributed to the emergence of twin exchange rates: one official and the other a much lower black market rate.

Economic growth in the decade that followed was weak, averaging a little less than 1.0 percent annually, although with sharp declines in the 2008 global financial crisis and again in 2012. Since 2012, annual growth rates have generally been less than 0.5%., with a sharp decline in the first quarter of 2018.

Source: Global Economic Monitor, World Bank

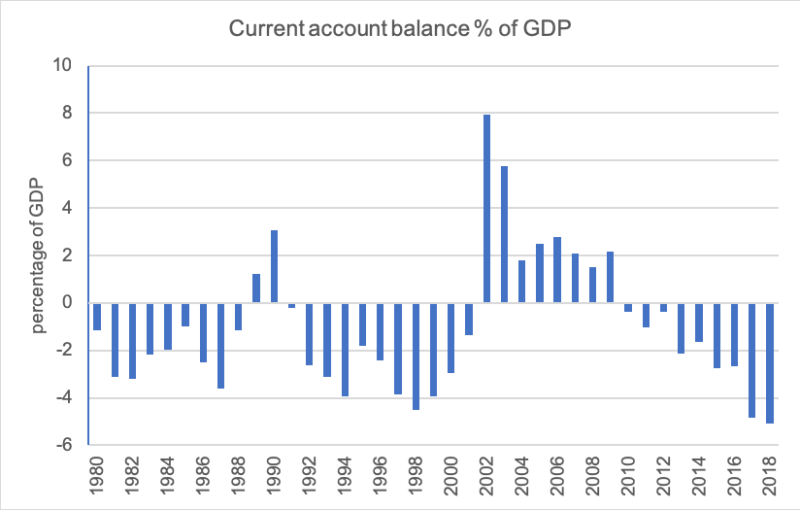
During the administrations of Presidents Néstor and Cristina Fernández de Kirchner (2003 – 2015), the slowing GDP growth rates coincided with a dramatic increase in public expenditure, reaching over 41% of GDP in late 2015. Government budget deficits exceeded 1.5% of GDP in eight of the past ten years. In 2002, Argentina had a trade surplus of $8.6 billion, which accounted for 16% of GDP, yet after a decade of protectionism, which threw key sectors into disarray with high tariffs suffocating agricultural exports and import restrictions putting the country at odds with global trading partners, this surplus had eroded into a deficit by 2015. Further, the Fernández de Kirchner administration imposed additional capital controls to prevent the flight of “hot money,” exacerbating the gap between the black market exchange rate, “dólar blue,” and the official exchange rate.

Efforts to Address the Crisis

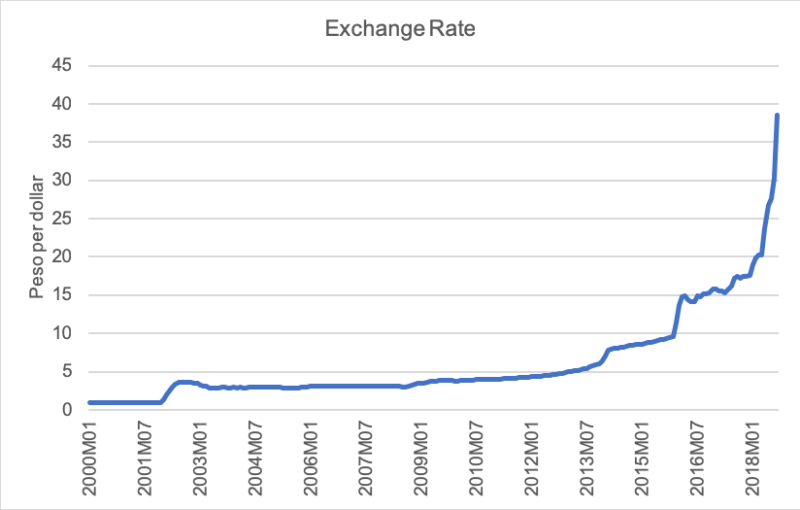
As the Macri administration assumed power in 2015, Argentina faced a number of challenges. The issue of the dual exchange rates was addressed by the imposing of a flexible exchange rate. While official exchange rate initially depreciated to meet the black market rate, depreciation soon accelerated thereafter.

Source: Bank for International Settlements

Rather than engaging in money creation, the Macri administration sought deficit financing in international capital markets. This increased Argentina’s vulnerability to both currency devaluation and further external financing opportunities, and in 2017 a variety of factors from rising US Federal Reserve interest rates to a terrible drought, set the currency into a downward spiral. While a depreciated peso could help the economy through increased exports, it also has important implications for debt financing and inflation. Most of Argentina’s debts are issued in US dollars, the so-called “original sin.” As the government engages in external deficit financing with foreign currency debt, and as the value of the peso drops, these debts become harder to pay off increasing investors’ fears of default. Investors then began selling these debts fostering a further drop in the value of the peso.

Source: International Monetary Fund, World Economic Outlook Database, April 2018

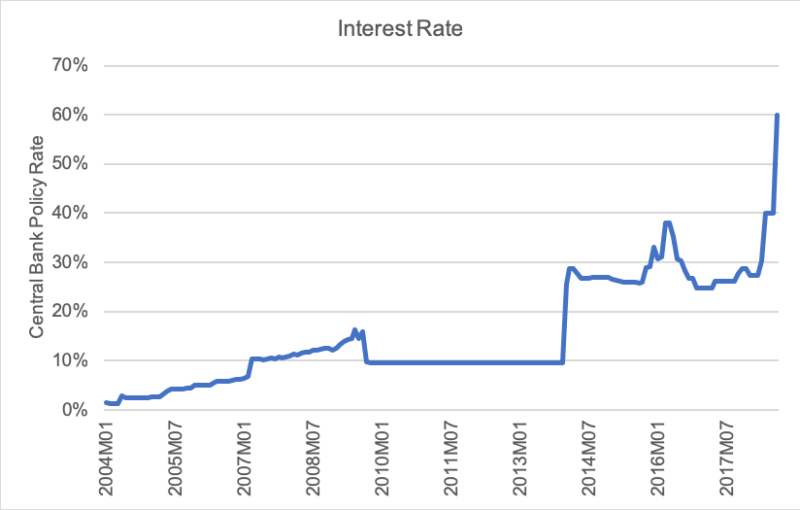
Inflation, after holding steady through 2012, has been in excess of 20% in each of the past four years, in part the result of the declining peso and rising import prices. Upon taking office, Marci returned monetary independence back to the Central Bank, which began tightening monetary policy in an attempt to lower inflation. One of the ways by which the Central Bank has sought to decrease inflation is through the sale of Central Bank bonds (LEBACS). Yet, as the peso depreciates, bonds issued previously are more difficult to repay. In turn, the Central Bank increased its interest rates to attract more lenders, raising its rates to an unprecedented high of 60% in August 2018, which effectively increasing existing debts to pay old ones, creating a snowball of central bank bonds.

Source: Bank for International Settlements

The $57.1 billion credit line from the IMF is intended to reassure investor confidence; however, the credit line demands a budget deficit reduction through fiscal austerity and a narrowing of the capital-account deficit. Argentine authorities have committed to accelerating the process of fiscal convergence and plan to meet these goals in two ways. First, it is slashing operating expenses, subsidies, and infrastructure. Second, it will introduce temporary export taxes on goods and services to increase revenue. In addition to these tough fiscal steps, the Central Bank is overhauling its monetary policy, as it switches to targeting monetary aggregates as its new nominal anchor. This strong monetary contraction is likely to be effective in slowing down inflation; however, if it is too effective, it is likely to deepen the recession. The exchange rate will be allowed to float within a target zone of 33 to 44 pesos to the dollar and the Central Bank will intervene in foreign exchange markets only if the exchange rate crosses this predetermined mark.

Macroprudential Policy

In the short run, Argentine policymakers could proactively enforce capital controls to stem the risks of rapid capital outflows. Accompanied by new monetary policy and a flexible exchange rate regime, both imposing controls on inflows and outflows of capital has been proven an effective prudential policy for most of emerging market economies. Controls on outflow prevent the risk of crises, while controls on inflow can insulate Argentina from external shocks. Moreover, Argentine overborrowing due to the “original sin” exposes the economy to external shocks that can cause a “sudden stop.” Taxation of privately held foreign-currency denominated assets and/or the incomes those assets generate can preventcountries from overborrowing and reduce the probability of financial crisis.

The analysis above provides context to the needed interventions that the government should make in order to mitigate the worst aspects of the crisis’ fallout. Moreover, as the likelihood of a global emerging markets crisis increases the state must prioritize efforts to insulate the economy against further instability.

Argentina’s Latest Crisis2018-11-17T23:02:44+00:00

The Turkish Currency and Debt Crises

Merih Uctum and Zhuo Xi
September 22, 2018

On August 9 the Turkish currency, the Lira, hit record lows and rattled emerging markets. The travails of the Argentinian economy subsequently weakened the Lira further. In this analysis article, we examine the economic and financial reasons behind the turmoil the economy is going through and discuss the future path it may take.

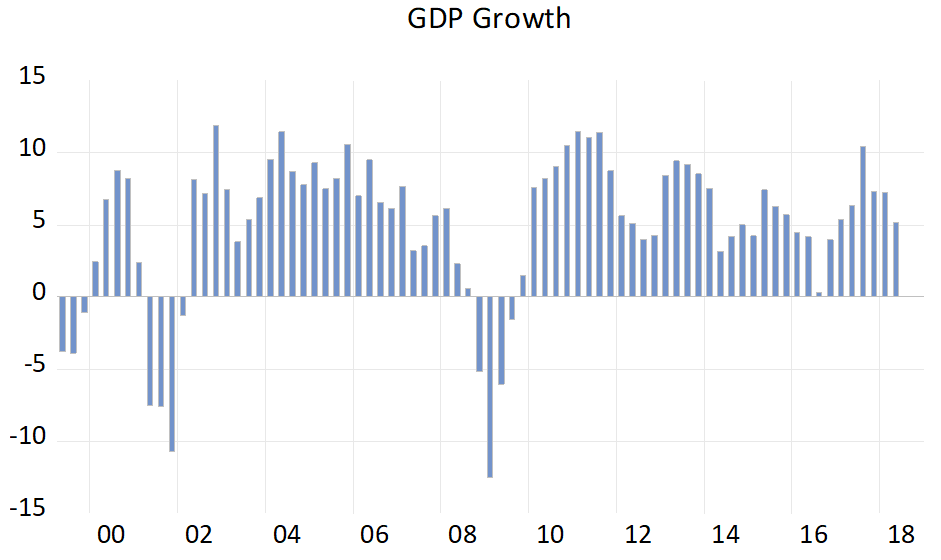
Following the sound economic policies adopted in the wake of the twin crises of the early 2000s, the economy experienced solid growth, except during the 2007-8 global financial crisis. Since 2010, the economy has averaged a healthy annual growth rate of 6.85% despite a slowdown since 2017.

Source: Federal Reserve Economic Data

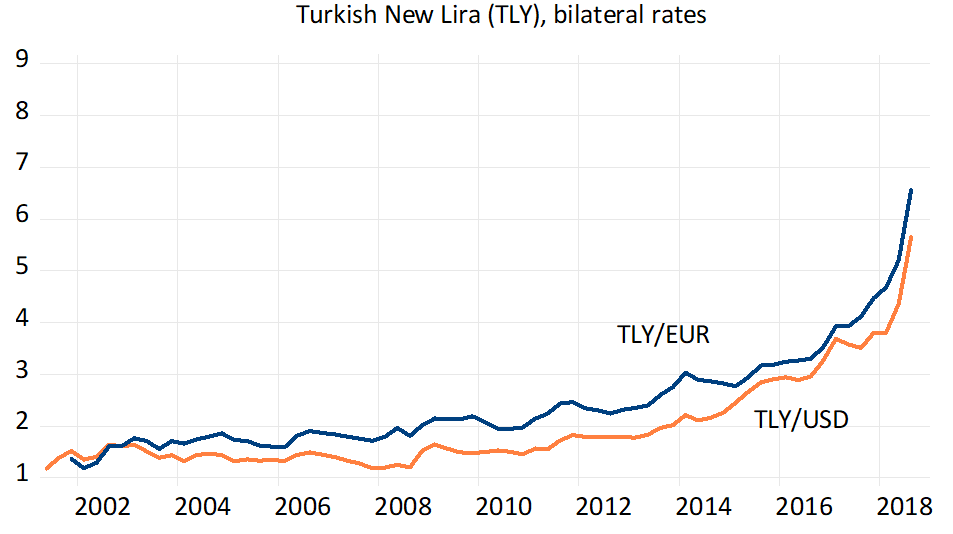
But the recent collapse of the currency was dramatic and does not square with the strong performance of the economy. Since 2008 the Lira depreciated by 82% against the dollar and 76% against the euro:

Source: The Central Bank of the Republic of Turkey

After hitting a historic low on August 13 of 7.0 Lira against the dollar and 7.93 against the euro, belated minor measures by the Central Bank of Turkey and a pledge of $15 billion worth of investment by Qatar in Turkey, the currency stabilized briefly before being hit again on August 18 as contagion from Argentina spread to other fragile currencies.

Public debt is usually one of the culprits in economic crises. However, in Turkey this is not the case at hand. While public finances in Western economies and in several emerging markets went into large deficits after 2008, and many are still struggling to reduce it, Turkish government debt has declined and been hovering at a modest 30% of GDP.

Source: The Central Bank of the Republic of Turkey

The story of the Turkish currency crisis, however, repeats a familiar scenario of emerging market crises. In an environment with ultra-low interest rates, strong growth in the economy is fueled by borrowed funds by the private sector, mostly from international capital markets.

During the first quarter of 2018, total external debt stock climbed to $466.67 bn, about half of GDP, with private debt making up 70% of it. Both the financial and nonfinancial (mostly corporate) sectors have been borrowing heavily since 2010. After ballooning during the financial crisis, corporate debt declined and steadied around 12% of GDP but rose steeply by 70% for the last three years. Foreign borrowing of financial institutions and banks continued and surpassed that of the corporate sector.

Source: The Central Bank of the Republic of Turkey

Although banks’ external roll over ratios (long-term external borrowing/repayments) are at a five-year low, rising interest rates in the West and a depreciating currency may generate sufficient risk to discourage lending by foreign banks.

Due to “original sin,” a term describing the fact that emerging markets economies cannot borrow in their own currency but only in foreign currency, usually US dollars, any event that triggers a depreciation of the currency and/or a rise in interest rates aggravates the foreign currency-denominated debt burden, when translated into the local currency. While various factors have been contributing to the accelerating depreciation of the Turkish Lira, it is the recent conflict with the United States that triggered the run on the currency.

Depreciation of a currency has several consequences on an economy. One beneficial impact is to stimulate exports over a certain period, but another dire and more immediate effect is to exacerbate inflation, which can undo the benefits of the first impact. In an economy dependent on oil imports and with endemic inflation, as in Turkey, the influence of depreciation on prices has been swift and painful.

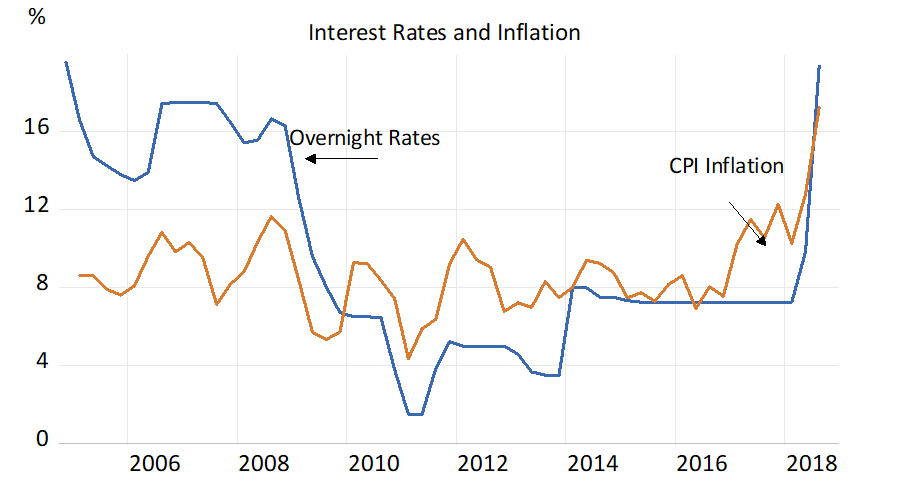
August data indicate that consumer price inflation reached 17.9%, more than quadrupling since the end of the financial crisis in 2009.

Source: The Central Bank of the Republic of Turkey

The conventional response of policymakers in such a situation is to raise interest rates, reschedule the external debt and implement austerity measures. However, policymakers in Turkey had been reluctant to change rates aggressively or to start discussions with the IMF. For comparison, Argentina, which is in the throes of a financial crisis, increased rates to more than 60% and is preparing to receive guidance from the IMF. After the long-awaited increase in the one-week repo rate by 625 basis points last week to 24 %, an increase above the expectations of the markets, the currency stabilized but several dark clouds in the horizon suggest further trouble ahead.

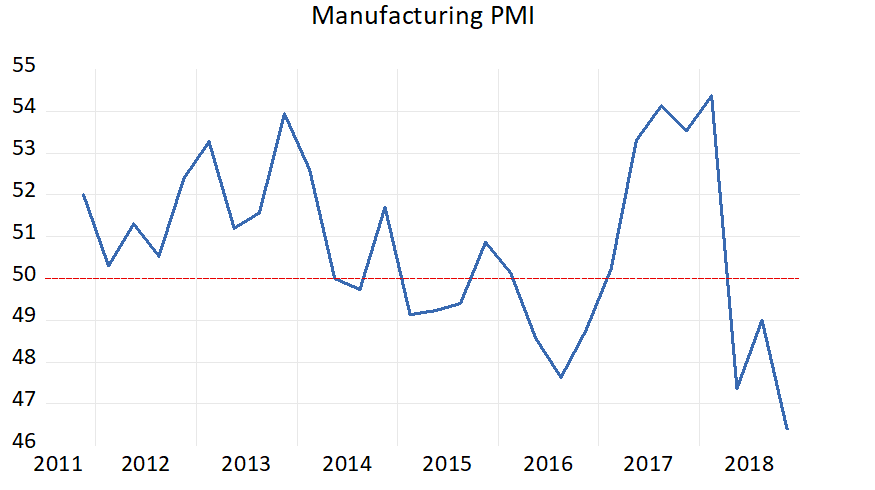
Leading indicators point to decreased confidence among households and businesses. The Purchasing Managers’ Index in manufacturing took a plunge since the beginning of the year, falling to 46.4 and creating further jitters in markets.

Source: Istanbul Chamber of Industry and HIS Markit

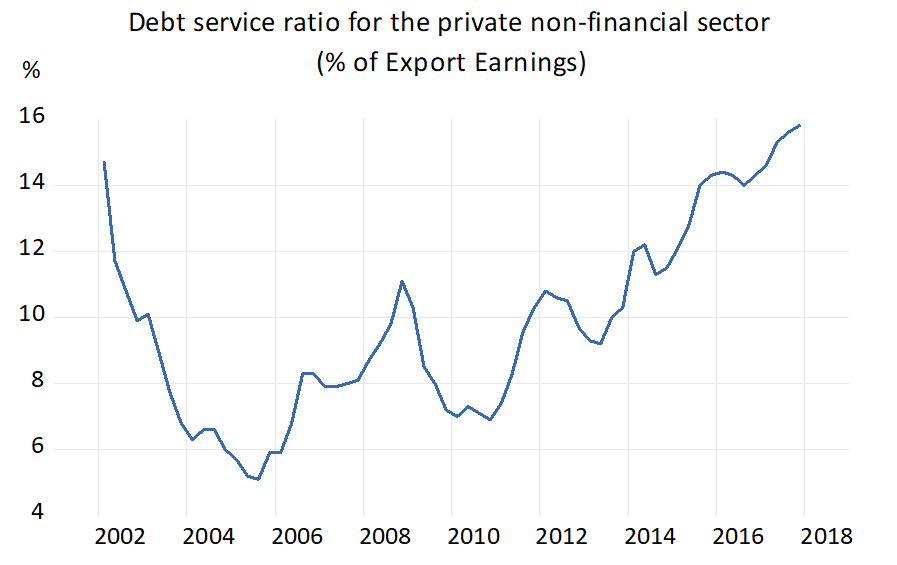
Total debt service as a percentage of exports is a measure used to assess sustainability of a country’s debt burden. Turkey’s debt service ratio increased continuously since 2013 and surpassed its 2002 crisis level for the first time at the end of 2017. Tightening by the Federal Reserve Bank, which is also likely to be followed by the European Central Bank, will continue to worsen the debt burden of the country.

Source: The Central Bank of the Republic of Turkey

It took two crises (2000 and 2001) followed by serious economic reforms and austerity measures to bring down inflationary expectations in Turkey. These policies earned back the confidence of markets, with an influx of foreign direct investment and access of the country to international financial markets. The recent events might have done damage to the economic progress achieved so far.

Currently, the main concern of market participants is the contagion of the Turkish crisis to similar economies with large foreign debt levels and to international banks that lent to Turkey. During August, the Turkish Lira dragged down the currencies of several emerging economies such as Argentina, South Africa, Brazil, Russia and India against the dollar, which reached their lowest levels since May. The European Central Bank expressed concern about the impact that a plummeting Turkish currency could have on Spanish, French and Italian banks that are holding Turkish assets. Another concern is about borrowers in Turkey who might start defaulting on their debt. Both of these events could hurt European banks.

The problems discussed above necessitate concerted and committed effort by the government to contain the currency and debt crises. International financial markets are bracing for hard times ahead.

The Turkish Currency and Debt Crises2018-09-22T22:44:31+00:00

A Primer on Rules of Origin in NAFTA Negotiations and What Is Next

Richard J Nugent III
December 22, 2017

The latest round of negotiations of the North American Free Trade Agreement (NAFTA) on November 21 ended with no major breakthroughs on contentious issues such as autos, dairy and rules of origin among others. The US administration’s demand that at least half of a NAFTA-qualifying vehicle should be made in the US and 85 percent in North America met stiff resistance from Canada and Mexico. Compromise on rules of origin for the North American automotive industry will matter for the successful renegotiation of NAFTA.

What is rules of origin (ROO) and why do we need it?

NAFTA ROO can be loosely defined as a set of rules that are used to determine whether a good can be considered as being made in North America. If this is the case, then these goods are typically exempt from tariff when traded between two North American countries. Article 401 of the Agreement defines “originating” in four ways: (i) goods wholly obtained in the NAFTA region; (ii) goods meeting the Annex 401 origin rule on specific ROO; (iii) goods produced entirely in the NAFTA region from originating materials; (iv) disassembled goods and goods described with their parts that do not meet the Annex 401 specific ROO but contain 60 percent NAFTA content in transaction value. Article 403.5.a increases the value-content requirement for motor vehicles to 62.5 percent. The Trump administration has proposed increasing this requirement to 85% and adding a 50% U.S.-specific value-content requirement for motor vehicles. This would require a larger portion of the motor vehicle production process to be sourced within the region and in the United States, particularly.

The use of ROO are in principle to deter trade deflection. The objective is to prevent resources from being sourced from a country outside a free-trade region for assembly inside the region and later exported at preferential tariff rates within the free-trade region. If for example a can opener is assembled in Mexico from parts that are made in Brazil, the origin of this can opener is Brazil. Were this can opener exported to Canada or the United States, it would be subject to MFN tariffs as opposed to NAFTA preferential tariff rates.

NAFTA eliminates tariffs on most goods originating in Canada, Mexico, and the United States. The ROO for goods that are not wholly obtained from the NAFTA region are based on a tariff-shift method, regional value-content method, or technical process test:

  • Under the tariff-shift method, a product earns preferential treatment under NAFTA if it has a different Harmonized Tariff System classification than its imported inputs for a particular statistical level. This means a product can earn NAFTA-origin status if it has been modified substantially within a NAFTA country.
  • The value-content method requires a good traded within the region to contain at least 50 to 60 percent NAFTA content to obtain origin status.
  • Technical process tests can require incorporation of specific parts or require a particular method of assembly. Technical process tests are found in machinery and equipment manufacturing and the apparel and textiles industry. A common technical process test used in the apparel and textile industry is “yarn-forward.” Yarn-forward requires the yarn that is used to make fabric be spun in the NAFTA region. Thus, cotton that is imported from Pakistan to Mexico, spun into cotton yarn, and later used to make slacks can be exported to the United States at preferential NAFTA rates. “Yarn-forward” observes Mexico as these pants’ origin. However, if the cotton is spun into yarn in Pakistan and then imported into Mexico where it is used to make the slacks, the origin of the slacks is now Pakistan.

How do the ROO work?

We can answer this question by reviewing examples of tariff classification and origin rulings issued by the U.S. Department for Customs and Border Patrol. In 2004, a U.S. producer sought to import wiper blade arms from Mexico, which were made with a “non- originating” flat-coated wire. This piece might have disqualified the wiper blade arm from NAFTA preferential treatment. However, the Mexican supplier substantially modified the wire: it was imported into Mexico under Chapter 72 and exported to the United States under subheading 8512.90 as a part of the wiper blade arm, which is qualified for preferential treatment under NAFTA. In 2010, a Canadian producer sought to export vehicle door locks. The door locks were assembled in Canada using components made exclusively in China and Germany. No component of the door lock originated in Canada. As such, the locks did not qualify for preferential treatment under NAFTA, and the rate of duty assigned to the locks was 5.7 percent.

How do ROO impact trade?

ROO exist to protect the interests of the countries participating in a multilateral free trade agreement, but could potentially distort trade flows. Distortions are particularly pervasive where global supply chains are big players in shaping the way trade occurs between two countries. The role of supply chains increases with the prevalence of global value chains in international trade. Studies have demonstrated that the expansion of these value chains means that production has become increasingly fragmented and supply chains are being vertically integrated across countries. Many firms in different countries are taking part in particular stages of the production process, together forming a global supply chain. This form of fragmented production results in intermediate inputs crossing international borders several times before final delivery. ROO therefore have rigid and costly implications for the way goods are produced and traded in global markets. Where global supply chains exist partially outside of a free trade agreement, a change in ROO could be potentially deleterious. When goods cross multiple borders or cross borders multiple times as in the fragmented production processes, they are exposed to more trade costs which can accumulate and compound before the goods are sold for final consumption. Thus, production which is labeled non-originating by a change in ROO can be very costly.

A study on how the characteristics of U.S. industries helped to shape NAFTA ROO finds that industries characterized by larger returns to scale sought tougher ROO, while industries dependent on global supply chains sought more permissive ROO. Firms that face ROO decide whether to comply with the rules so as to export at preferential tariff rates, or to not comply with the rules and source inputs unconditionally. Researchers who study this decision by Mexican firms find that the ROO for final goods led to a 115 percentage point reduction in imports of intermediaries from non-NAFTA countries after the implementation of NAFTA.

ROO are a useful component of free trade agreements in their role to prevent trade deflection. However, the rules can be exploited in the objective of industry protection and can potentially distort trade flows. Additionally, if ROO are changed in a way that disrupts global supply chains, the costs of delivering some goods could mount considerably. Furthermore, if the parties renegotiating NAFTA stand firm regarding the motor vehicles regional content requirement, the future of NAFTA could be in a precarious place.
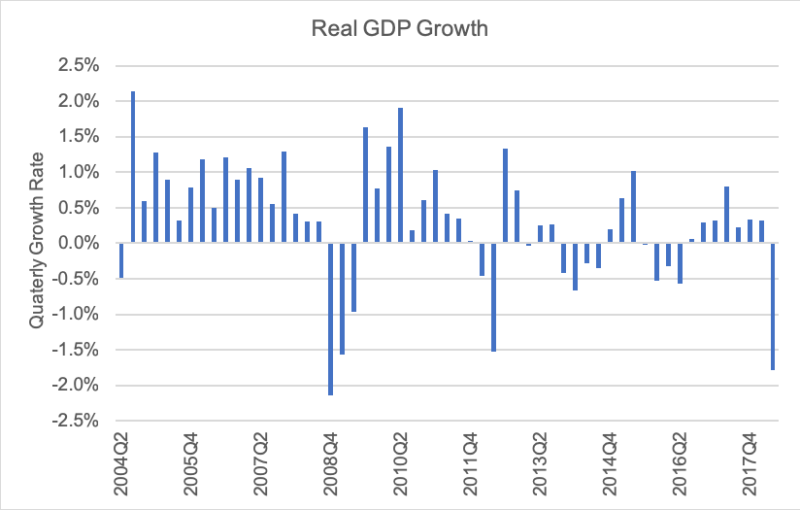
A Primer on Rules of Origin in NAFTA Negotiations and What Is Next2018-07-04T19:37:47+00:00
Go to Top