Greek Debt in Historical Perspective: An Opinion Article

Anthony Rodolakis
November 22, 2017

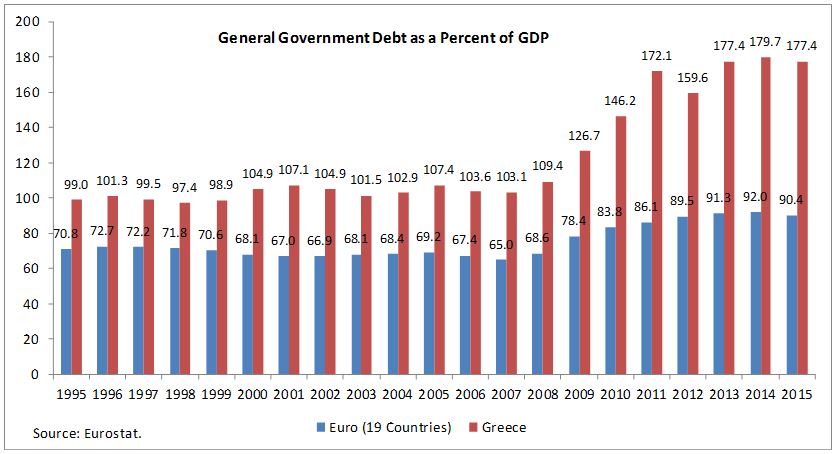
Current fiscal proposals are projected to lead to a sizeable increase in U.S. debt and while people point to the Greek crisis to warn about high debt, a closer look at Greece’s debt history reveals few similarities. Modern Greek economic history is a history of debt. Greece is the country with more years in default to its creditors than any other European nation, being in default in 48 percent of the years since 1826.

[1] As of 2016, Greek debt stood at roughly 181 percent of GDP and more than twice the average of the Euro area (19 countries). In this post, we present a brief narrative of some selected major episodes of the buildup of debt in Greece to highlight the different sources of Greece’s debt problems over its recent history.

The 19th Century

By the late 1700s Greece’s proximity to Europe and a flourishing trade had allowed the development of a rich merchant class which was able to benefit from the European intellectual enlightenment – and to a large extent precipitate the ground for political independence from the Ottoman Turks. The vast majority of the peasantry, however, had been left in a semi-feudal status and beholden to the local oligarchies for favors.

Greece gained independence in 1830, following a turbulent revolutionary war. The debt buildup of that period was largely for loans to finance the war expenditures. The debt burdens the country had accumulated during the war lingered through the 1830s and 1840s and eventually led to a default in 1843. Fifty years were to elapse before the default was terminated.[2]

Following the final settlement of the default in 1878, Greece tapped the French capital markets for close to 500,000,000 francs. The terms, however, contained substantial “haircuts,” which was often the case. For example, an 1884 loan of 170,000,000 francs was offered at 68.5 percent, though even then it was undersubscribed with net proceeds of only 100,000,000 francs.[3] In all cases, bondholders were pledged a variety of receipts such as from the state monopolies of petroleum, matches, playing cards, tobacco consumption taxes, and port custom receipts. Nevertheless, both British and French financial experts sent to Greece around this time to examine the stability of finances and the ability to repay the contracted loans on behalf of their banking institutions concluded that bankruptcy was inevitable.[4]

The inability to maintain external debt obligations together with the expenses for the program of internal infrastructure development as well as renewed military expenditures led to the 1893 suspension of payments.

The 20th Century

During the first decade of the 20th century, Greece pursued a strict policy of monetary restraint and fiscal discipline that led to an appreciating drachma. Greece enjoyed rapid growth in certain sectors with the shipping industry exploiting the expanding trade opportunities. The fiscal and monetary self-discipline of those years paid off with net positive capital inflows from abroad. By 1920, the end of the Balkan wars and World War I saw a doubling of the territorial size and population of Greece.

Fast forwarding, the end of World War II found Greece and Europe in ruins, but Greece endured another round of fighting. Through 1949 Greece fought a bloody civil war between communists and the National Army that devastated the country, with widespread infrastructure destruction and rapid migration abroad. The Civil War retarded political and economic advances in Greece for several decades, handicapping the country’s economic growth compared to other European nations.

The 1950s and 1960s saw rapid rates of growth in the Greek economy premised on large public investments on infrastructure, foreign direct investment, residential investment and a strengthening commercial shipping sector. Despite this growth, “the development during this period is dependent on foreign funding and is asymmetric and unproductive.”[5] In 1950 a Daily Herald correspondent concluded that there are two Greek kingdoms: that of the new-rich of the center of Athens and the aristocratic suburbs and that of the rest of Greece where malnutrition and tuberculosis reigned.

With the entry into the European Economic Community in 1981, Greece was able to participate in a community of advanced and wealthy nations. However, the availability of development funds was to prove a double-edged sword. “According to OECD data, between 1981 and 1988, the number of central government public sector employees increased six times more than the active population of the country during the same time period, and public expenditures as a percent of the domestic product skyrocketed from 21 percent in 1976 to 51 percent in 1988.”[6] Overall, between “1975 and 1987, in 13 years, $18.4 billion in loans were contracted, of which $14.8 billion, or 80.6 percent, were allocated for the servicing of existing debt”[7] and not for development. At the end of the decade, the debt/GDP ratio stood at 66 percent.

The 1990s saw Greece struggling to implement the conditions required by the European Union (EU) convergence criteria on its path to full monetary union within the Eurozone. Successive Greek governments attempted to contain inflation and largely succeeded, but inflows from EU funds continued alongside the inability to balance the budget. The conservative government of the early 1990s increased debt by 295 percent, which pushed total debt as a share of GDP above 100 percent. Total debt servicing consumed 151.2 percent of regular government receipts as of the end of 1993.[8]

With the entry of Greece into the Eurozone in 2001 a new era of optimism and GDP growth had begun, unfortunately, premised on loans at deceptively low-interest rates. In the 2000s Greece was exposed to an international financial environment flooded with liquidity and without any real convergence with the “core” of the EU, continued lack of fiscal discipline, and with already high levels of debt. Greece was allowed to accumulate a debt of over 300 billion Euros that was to allocate the funds to its preferred oligarchic economic cartels that controlled construction projects and other outlets for the contracted loans, as well as allow largesse to the ever-expanding public sector.

The 2000s, much like the 1980s and the 1990s, proved a lost decade. The long-promised and much-needed deregulation of cartels across industrial sectors, labor market liberalization, privatization of publicly controlled enterprises, improvement of public administration, restructuring of public and private pension systems, and efficient absorption of EU funds for infrastructure upgrades were delayed or outright ignored by stakeholders. Political leaders avoided any and all direct conflict with their constituencies that tended to be concentrated in the public and private sector unions.

In Sum

The staggering Greek debt accumulated over the last 20 years is not a unique phenomenon for present-day Greece. Since the 1820s historical, political, demographic, and sociological circumstances have led to multiple periods of borrowing, default, and setbacks to growth as the nation struggled to repay its debts. The record-setting level of the current debt makes Greece extremely fragile and vulnerable to unforeseen circumstances.

[1]This Time is Different: Eight Centuries of Financial Folly”, Carmen M. Reinhart and Kenneth S. Rogoff, Princeton University Press, 2011.

[2]State Insolvency and Foreign Bondholders: Selected Case Histories of Governmental Foreign Bond Defaults and Debt Readjustments”, William H. Wynne, 1951, p. 298.

[3] Ibid. p. 298.

[4] Ibid p. 304

[5] Ibid. p. 271.

[6]Foreign Loans at the birth and development of the New Greek State 1824-2009,” T. M. Hliadakis, 2011, Mpatsioulas Publishers, p. 364.

[7] Ibid. Page 393.

[8] Ibid. Page 419.

The views and opinions expressed in this article are those of the author and do not necessarily reflect any policy or position of the New York State Assembly.
Greek Debt in Historical Perspective: An Opinion Article2018-07-04T19:37:48+00:00

Federal Funds Rate Hike and Sovereign Risk in Latin America

Miguel Acosta-Henao
August 31, 2017

The Fed has started increasing the federal funds rate, reversing its decade long accommodative monetary policy.  The last time such a reversal in the Fed policy occurred, the impact on emerging markets in Latin America was deleterious. This article examines if history will repeat itself. 

By the end of the 1970s the most important Latin American economies had opened their capital accounts to the rest of the world and received a considerable amount of capital inflows that were financing sovereign debt.  However, this ended when the Federal Reserve (FED), led by Paul Volcker, pursued a sharp disinflation, increasing the federal funds rate, and resulting in high capital outflows from emerging markets to the U.S. These flows caused long currency depreciations and increased the risk premium of sovereign bonds in those countries. As a result, as documented by Krugman (2009), Mexico, Argentina and Brazil went into technical default, capital inflows ceased,  inflation sky rocketed (especially in Argentina) and these economies, as well as the rest of the region, entered into deep recessions that took a severe toll on Latin America’s potential growth through the 1980s.   

Currently, ten years after the start of the great recession, inflation is converging to the FED’s 2% target and the labor market in the U.S. continues giving signals of strength–an unemployment rate of 4.3% and a payroll job growth matching the growth before the start of the crisis in 2007. These facts have led the FED to increase the federal fund’s rate and to announce more hikes during this year.

Latin American countries are not as indebted as they were at the beginning of the 1980s (except for Venezuela) nor do they have the same weak macroeconomic institutions they had in the past. Economic fragilities, however, exist.  Between 2003 and 2013 Latin America received a considerable amount of foreign investment. Unlike the 1970s, however, it was in the form of gross capital formation directed to the commodities sector (mainly oil). This meant that governmental borrowing was not as significant as it was thirty years ago. Nevertheless, a reversal of capital flows would still affect the whole external debt of the region, whether is public or private, due to currency depreciation and a negative effect on each economy’s sovereign risk, which could lead these countries to the brink of a recession. One part of this process has already started following the commodity price shocks, with average currency depreciations of 30% between 2014 and 2017 for Mexico, Brazil, Colombia, Chile, and Peru.

Sovereign Risk in Latin America

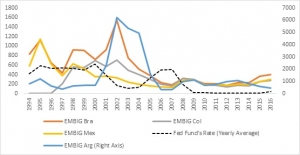
The benchmark estimate of country interest rate spreads for emerging markets is J.P Morgan’s Emerging Market Bond Index Global, EMBIG.  The Index, which compares a composite of bonds with different maturities and liquidities in each country with a similar composite for the U.S, reflects sovereign risk in those countries, is available starting in 1994 for selected Latin American countries. Figure 1 shows both the evolution of the EMBIG from 1994 for the most representative emerging countries in Latin America (excluding Venezuela), and of the federal funds rate during the same period.

Figure 1: EMBIG Selected Latin American economies (basis points).

Between 1998 and 2001, most Latin American economies suffered deep recessions that started with the increase in their sovereign risks, as it can be seen in the graph. But, in line with the massive capital inflows that the region received between 2003 and 2013, the EMBIG of each country substantially decreased during those years.  It has risen modestly recently, although not at all close to the levels seen before the year 2002.

Impact of the FED Funds Rate on Sovereign Risk in Latin America

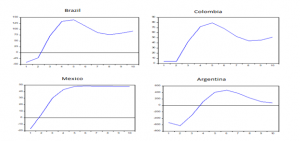
For each country, we estimate an econometric model that allows us to see the response of each country’s sovereign risk to the FED’s rate hike. For each country in the sample, Figure 2 shows the response of sovereign risk to a 100 basis point increase in the federal funds rate.

Figure 2: EMBIG response to a to 100 points increase in the federal funds rate (basis points).

Figure 2 presents the results of our estimation, which show a large and sustained response of interest rates in each of the countries to a rise in the U.S. federal funds rate.  These results are in line with those of Uribe and Yue (2006), who show that for a group of emerging markets, an increase in federal funds rate leads country spreads to fall and then display a large, delayed overshooting.  Clearly, the results are alarming: an interest rate hike in the U.S. has a permanent negative effect over the country risk for Latin America, let alone a continuous path of interest rate hikes like the one the FED plans to do.

Will history repeat itself?

Contrary to the episode in the 1980s, most Latin American countries have central banks with full independence and explicit inflation targets. External debt as a share of GDP is, on average, less than 70% compared to the 3-digit numbers in the 1980s. Some countries like Colombia have explicit fiscal rules that contribute to smooth the cycle through fiscal policy while committing to keep the public deficit within a defined range. However, it doesn’t mean that the region is completely shielded against the FED’s hike. The increase in country risk compromises investment in countries that still lack physical infrastructure to compete with other emerging countries such as China or a number in South East Asia; the volatility that this brings to the business cycle contributes an increase in uncertainty about the future and may generate misallocation of capital among investors, and pressures over governments to raise taxes and reduce government spending (in order to avoid a down grade in their risk rating) may imply fiscal reforms that seriously slows down (or even contract) the growth rate of the GDP in those countries.

It is then important that not only governments but also central banks among those countries prepare themselves correctly for what may come. Recent literature has pointed out the importance of capital controls in booms and busts as a potential tool to help reduce the volatility of the business cycle. Also, imminent tax reforms like the one Colombia had during 2016 (which aimed to increased tax revenue) could be complemented with institutional reforms that contribute to improving productivity, which has been Latin America’s longer-term problem as shown by Restuccia (2013). All in all, the main point is that, even though the region seems more prepared than before to a FED’s hike, it is still vulnerable according to our empirical analysis; therefore, the region should consider new policy tools as well as important structural reforms to reduce the exposure that it has to foreign interest rate shocks.


Federal Funds Rate Hike and Sovereign Risk in Latin America2018-07-04T19:37:49+00:00

A Finger Exercise on Hyperglobalization

Paul Krugman
July 11, 2017

The days when surging world trade was the big story seem like a long time ago. For one thing, trade has stopped surging, and seems to have plateaued. For another, we have faced more pressing issues, like financial crisis.

But I recently gave a presentation on trade issues, have been playing around with them again, and anyway want to take occasional breaks from the headlines. So I find myself trying to find simple ways to talk about “hyperglobalization,” the surge in trade from around 1990 to the eve of the Great Recession. None of the underlying ideas is new, but maybe some people will find the exposition helpful.

The idea here is to think about the effects of transport costs and other barriers to trade pretty much the same way trade economists have long thought about “effective protection.” 

This concept was introduced mainly as a way to understand what was really happening in countries attempting import-substituting industrialization. The idea was something like this: consider what happens if a country places a tariff on car imports, but not on imports of auto parts. What it’s really protecting, then, is the activity of auto assembly, making it profitable even if costs are higher than they are abroad. And the extent to which those costs can be higher can easily be much bigger than the tariff rate.

Suppose, for example, that you put a 20% tariff on cars, but can import parts that account for half the value of an imported car. Then assembling cars becomes worth doing even if it costs 40% more in your country than in the potential exporter: a nominal 20% tariff becomes a 40% effective rate of protection.

Now let’s switch the story around, and talk about a good an emerging market might be able to export to an advanced economy. Let’s say that in the advanced country it costs 100 to produce this good, of which 50 is intermediate inputs and 50 assembly. The emerging market, we’ll assume, can’t produce the inputs, but could do the assembly using imported inputs. There are, however, transport costs – say 10% of the value of any goods shipped.

If we were talking only about trade in final goods, this would mean that the emerging market could export if its costs were 10% less – 91, in this case. But we’ve assumed that it can’t do the whole process. It can do the assembly, and will if its final costs including inputs are less than 91. But the inputs will cost 55 because of transport. And this means that to make exporting work it must have cost less than 91-55=36, compared with 50 in the advanced country.

That is, to overcome 10% transport costs this assembly operation must be 28% cheaper than in the advanced country.

But this in turn means that even a seemingly small decline in transport costs could have a large effect on the location of production, because it drastically reduces the production cost advantage emerging markets need to have. And it leads to an even more disproportionate effect on the volume of trade, because it leads to a sharp increase in shipments of intermediate goods as well as final goods. That is, we get a lot of “value chain” trade.

This, I think, is what happened after 1990, partly because of containerization, partly because of trade liberalization in developing countries. But it’s also looking more and more like a one-time thing.

A Finger Exercise on Hyperglobalization2018-07-04T19:37:51+00:00

The United States, Mexico, and NAFTA

The Economic Studies Group
Jun 28, 2017

The terms of current and proposed U.S. trade agreements are getting renewed attention as to their impacts on the U.S. economy and workforce.  Recently, U.S. trade with Mexico has become a particular focus for reconsideration as trade between the two countries has grown remarkably since the 1994 passage of the North American Free Trade Agreement (NAFTA), and reaching agreement on the benefits and costs of NAFTA has been hard.

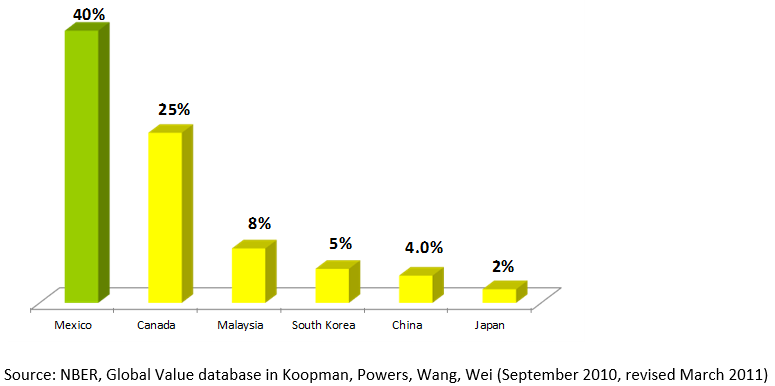
Most of the recent discussion centered around the impact of trade on the loss of U.S. jobs in manufacturing.  While the factors causing this outcome are diverse and not limited to NAFTA, ranging from globalization and automation to monetary and fiscal policies, the argument leaves out the benefits that are derived from trade with Mexico   Several features of U.S.-Mexico trade flows were noted in a recent analysis of the U.S-Mexico trade relationship by the Trade and NAFTA Office of the Ministry of the Economy of Mexico, and could warrant consideration in any review of NAFTA.  In this post, we highlight four of the features of that analysis: the intra-industry nature of goods trade, the U.S. surplus in services trade, the specialization in agricultural trade and the geographic concentration of the importance of Mexico to state exports.   Each of these presents an aspect of U.S.-Mexico trade that is related to the potential benefits and costs of a renegotiated agreement.

U.S. trade with Mexico has grown dramatically since the passage of NAFTA.  The figure below shows roughly balanced trade in 1994 totaling $100 billion expanding to $525 billion by 2016 and with a bilateral deficit of about $63 billion.  With $1.5 billion dollars in products traded bilaterally each day, Mexico has become the third largest partner and the second largest export market for the U.S., and the second largest supplier of imports. 

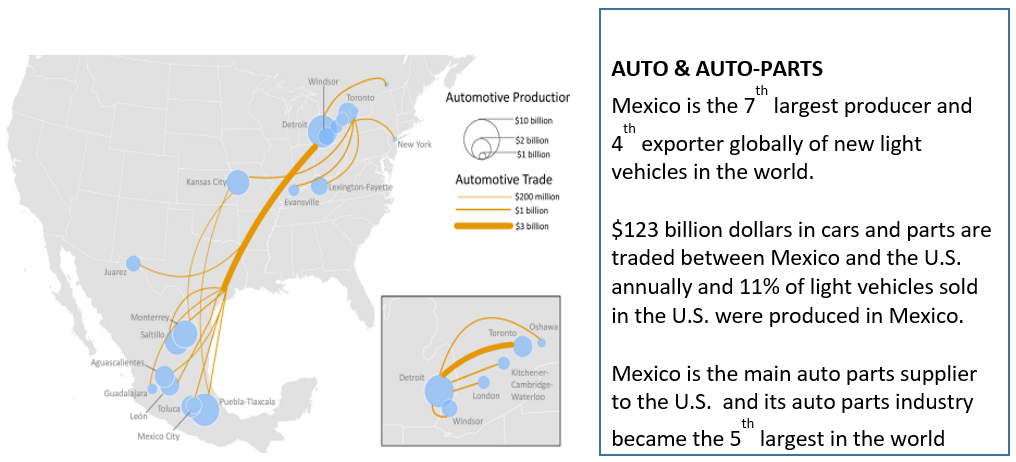
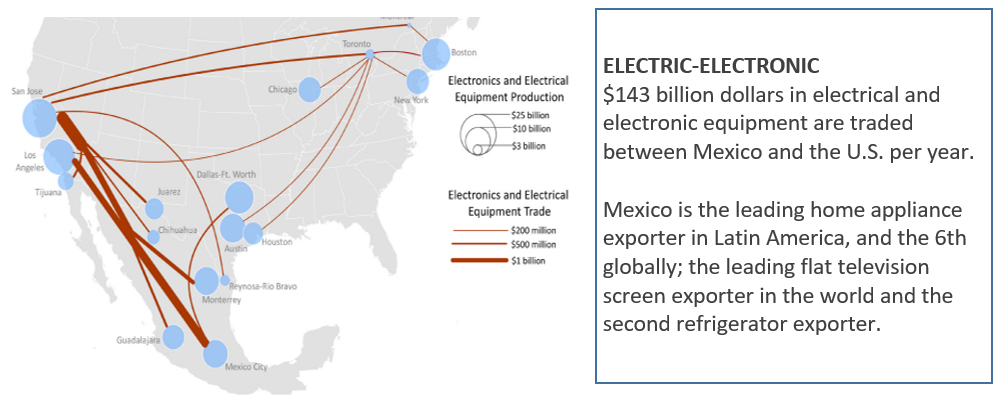
A closer look at the trade flows indicates that trade has strengthened supply chains in key industries, particularly autos and electronics.


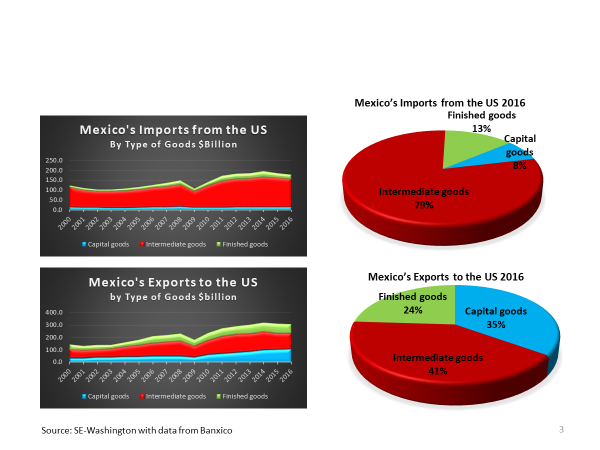
These intermediate goods also comprise a large share of Mexico’s exports to the U.S., though there is a larger component of finished goods.  These bilateral trade flows further indicate that U.S.-Mexico trade reflects the expanding supply chain between manufacturers in the two countries.


More generally, U.S, exports to Mexico consist largely of intermediate goods or products that are used as inputs into the manufacturers in the two countries.  In fact, it has been estimated that there is 40 percent value added by U.S. producers in Mexico’s exports, a figure much larger than that for other suppliers.


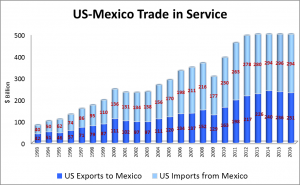
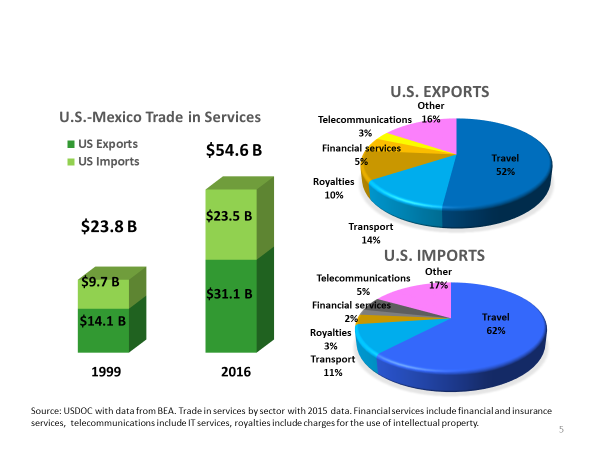
U.S. – Mexico trade in services has also expanded greatly since the 1990s.  Much of that trade is in the area of travel and transportation, rough 65 to 70 percent, but there is also trade in telecommunications and financial services.  And similar to overall U.S. trade flows, the U.S. maintains a surplus in services trade with Mexico.


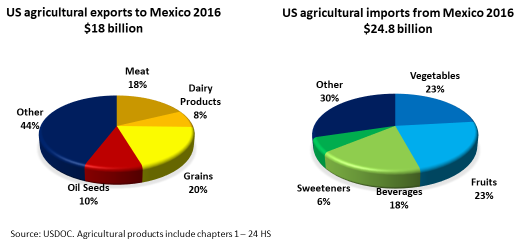
Trade in agricultural products between the two countries is also large, with the U.S. exporting about $18 billion worth of products to Mexico and importing almost $25 billion worth of products from Mexico annually.  The composition of this trade reflects the resources of the two countries.  A look at the 2016 trade figures below shows, U.S. exports consist of meats, dairy products, grains, and oilseeds while U.S. imports comprise a large amount of fruits, vegetables, and beverages.


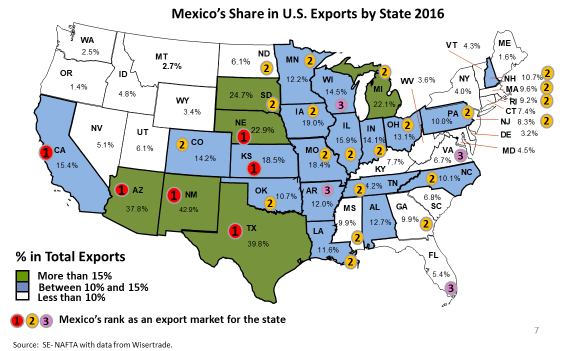
The concentration of U.S. goods exports to Mexico in autos, electronics, and other intermediate inputs together with these agricultural exports of U.S. staples suggests an uneven geographic pattern of the source of these exports.  The figure below looks at states and shows that Mexico is an important export market for the four border states, and South Dakota, Nebraska, Iowa, Missouri, and Kansas in the Midwest, and Michigan, and Mexico ranks among the second and third largest export markets for 21 additional states.


The data on trade flows between the U.S. and Mexico suggest that the economic relationship between the two countries has several specific features that should be considered in the discussion of a renegotiation of NAFTA.  The evolution of goods trade into a large component that reflects supply chains within manufacturing firms and industries could be costly to break.  The composition of trade in agricultural products and services actually suggests a more typical pattern of trade observed with other countries.   So, it is really with regard to goods trade that negotiators need to bear in mind that the composition of trade flows reflects the evolution of intra-firm and inter-industry relationships that have developed over time.     

The United States, Mexico, and NAFTA2018-07-04T19:37:51+00:00

A Primer on Brexit

Merih Uctum
December 20, 2016

In a referendum on June 23, 2016 Britain voted to leave the European single market paving the way to further turmoil in Europe. This note summarizes why this happened and the implications for Britain when it pulls out.

A brief historical background:

  • European Economic Community (EEC), a free trade area, was established in 1958. Members agreed to a common external tariff on all goods entering the union and comply with common, harmonized rules and standards. The UK joined the EEC in 1973.
  • In 1993 the European Single Market, or the European Union (EU), was completed upon the four-freedoms: freedom of movement of goods, services, capital and people. Britain was among the EU’s founding members.
  • In 1999 a subset of the EU members adopted the euro, the single currency, establishing the European Monetary Union (EMU). Britain did not join it. Access to the single market imposes a variety of rules of engagement involving labor laws, immigration rules, common regulations and standards, which restrain local sovereignty. The relationship of Britain with the EU was difficult and tensions culminated in the vote for Brexit.


Main arguments of the leavers:

(i) Britain will save on the 350 million pounds it sends every week; (ii) Without EU’s burdensome regulations, British companies will be more competitive outside EU; (iii) Britain will be able to control its immigration from the EU, which is the most central issue in the Brexit debate based on the belief that EU migrants are taking jobs from the locals and exploit the country’s benefit system.

A fairly short time table:

According to the Lisbon Treaty, any member can withdraw from the EU unilaterally by invoking Article 50, which Britain announced it will do in spring of 2017. The withdrawal will become effective within two years, during which Britain will engage in negotiations with its partners to secure alternative arrangements.  These treaties have to be approved with unanimity in the Council of Europe and ratified by each of the remaining 27 EU member states.

     The government is expected to opt for a Hard Brexit, involving departure from the EU, the customs union, the single market and reaching free trade agreements with each partner. In a Soft Brexit, it would leave parts of the single market, subject to uncertain negotiations with the EU.

Impact on trade for Britain of a Hard Exit

Trade has two components: goods and services. Both have to be addressed to answer this question:

(i) Trade in goods with the EU

This component makes up about half Britain’s trade volume and over 4 million British jobs depend on exports to the EU. The leavers argue that the EU sells as much to Britain, so there is room for fruitful negotiations.  But disentangling from the current arrangements is very difficult:

  • Today trade in goods depends on complex cross-border supply chains, and final goods have more than one origin. Leaving the EU will take Britain out of these supply chains.
  • To prevent goods of third-party countries entering the bloc by the back door, the EU implements the Rules of Origin principle to all its trading partners in a Free Trade agreement: the partners have to prove that the product is made mostly in the domestic economy. This is a very costly process.

(ii) Trade in services

This component, in particular that in financial services, comprises most of Britain’s interaction with the EU. More than half of the capital market and investment banking revenues generated in the City in 2012 were paid by EU clients. After Brexit, Britain will lose its “passports”, which allow financial services companies licensed in one EU state to provide services across the bloc.  Major US, Japanese and Swiss banks, asset management and insurance companies use the UK as a hub for passporting into other EU markets, where they do not have branches. They are likely to move out. Without passport financial companies need to negotiate bilaterally with individual countries for each service they will sell.

     Absent this system, to operate in the EU without having to establish a subsidiary, non-EU banks and investment firms need to follow “Equivalence rules”, which require their domestic regulations to replicate those in Europe. If domestic regulatory framework is different, each firm has to negotiate with the EU a separate agreement for each service it wants to trade with the union.

     Leavers argue that Britain can reorient its service trade to non-EU countries because trade in services, as opposed to goods, will not involve transport costs. This view is challenged by International Monetary Fund’s finding that increased distance among partners hurts trade in both components because it harms services trade considerably since some services are complementary to goods trade.

Economic cost of a Hard Brexit

Trade with the EU makes up about half of Britain’s trade volume. This compares to 14% to the United States and about 30% to non-EU partners. Estimates of economic costs vary hugely up to 10% of a decline in GDP in 15 years, with a deleterious effect on public finances, social services and investment. The resilience of the economy after the referendum is not indicative of what will happen when Britain triggers Article 50 and adopts the Hard Brexit. Since the referendum Britain is enjoying the privileges of the single market and benefiting from a substantial depreciation of the currency, which provided a considerable competitive edge to British exporters to the EU.

     Limiting EU-originated immigration is estimated to generate a modest increase in wages of medium and higher-income workers and a modest decrease in wages of low-income workers. A slowdown of the economy is expected to hurt employment more. Moreover, disappearance of EU subsidies to farmers will depress earnings in agriculture and will represent a political challenge.

     Leavers argue that deregulation will help the economy because it will increase productivity and therefore output growth.  However, the UK has already one of the lighter regulated economies and the EU rules are similar to international standards that any non-EU country should be implementing. In addition, after the 2008 crisis to calm the voters’ anger the UK had itself tightened its rules.  Thus, any productivity gain due to deregulation would be negligible. The loss from potentially decreased trade is more likely to lower productivity gains acquired in the last decade.

Alternative models that can replace the Single Market

  • World Trade Organization, WTO, rules set tariffs on goods and services traded worldwide and create a restricted market access for trade in goods.
  • Free Trade agreement (Example Canada-EU) eliminates all tariffs between partners. It takes a long time to establish and is subject to the costly “Country of Origin” rule.
  • European Economic Area, EEA (Norway/Iceland/Liechtenstein) allows countries access to the single market but also binds them, without any say in the matter, by the EU single market rules and regulations and makes them contribute to the EU budget. This is an option contradicting the Brexit spirit that seeks to move out of the EU’s regulatory environment.
  • Switzerland-style deal is similar to the EEA rules but with more flexibility. Bilateral agreements allow Switzerland to pick and choose the areas of the union they want to participate and the rules they want to follow. It requires constant renegotiations. It is not clear that the EU will accept the Swiss vote to limit EU immigration.
  • EU banking union allows passporting for financial services if financial institutions abide by the regulations of the European Banking Authority and the Single Supervisory Mechanism, and if the UK allows free labor mobility in financial services.

Britain is moving towards uncharted waters and the government does not appear to have a plan of action.   The economic and political implications for the country and Europe can be substantial.

A Primer on Brexit2018-07-04T19:37:52+00:00
Go to Top