

William B. Thorne
November 27, 2019
Taiwan’s National Health Insurance Overhaul
Taiwan’s single-payer National Health Insurance system was implemented in 1995 and designed using the U.S. Medicare program as a template. At a time when the future of the US healthcare system is an important topic that is likely to affect election results, what lessons can we draw form the Taiwanese experience? The switch to a single-payer system is appealing to study because it was a fundamental change and restructuring of how healthcare was provided, not a relatively small tweak to funding. The more major and transformative a change is made in a short time period, the easier it becomes to detect effects in the data. Taiwan was one such major shift and it saw many improvements in health outcomes after the change. However, it is possible that those improvements would have happened anyway without the change in system; we do not know what health outcomes in Taiwan would have been without the change in its healthcare system. We can’t observe Taiwan with and without the policy reform, but statistical techniques allow us to get an estimate of the causal effect of the healthcare reform on health outcomes. In this post we outline the key components of Taiwan’s healthcare reform and report the results of our analysis that show how the policy reform led to fundamental healthcare improvements.
Major Changes to Taiwan’s Healthcare System
Chen Shih-Chung Minister of Health and Welfare for Taiwan, summarized the 1995 switch:
National Health Insurance (NHI) integrated medical programs from existing insurance systems for laborers, farmers, and government employees, which covered only half the population, and has since been expanded to provide equal coverage to all citizens from birth, regardless of age, financial status or employment status. Furthermore, all foreigners who legally work or reside in Taiwan are also afforded the same coverage… Yet healthcare costs are far lower in Taiwan than in most highly developed countries in Europe and North America, at $1,430 per capita per year.
For the average person in Taiwan, the change meant that, when you use the healthcare system rather than buying insurance and billing the insurance company, your bill would be sent to the government with little or no payment out of pocket. Healthy people enter the system to share the costs of healthcare; coverage in Taiwan increased dramatically, from 57% to 99%, and approval ratings for the program have been high.
The government can bargain and control costs and to distribute them through taxation. It also allows for economies of scale in administration, rather than each insurance company conducting its own administration. The administrative costs are now some of the lowest in the world, being around 2% of total healthcare spending. By reducing the need to make a payment when visiting a doctor, people may be more inclined to visit a doctor before their illness gets worse. High-quality, available, preventative care might save on healthcare costs in the long run. Ultimately these are claims that must be assessed by what we see in the data. Comparing the results Taiwan saw after the reform with what Taiwan would have been like without the reforms, is the key problem researchers must solve.
How to Assess the Impact of Taiwan’s Healthcare Overhaul
A neat solution to the issue of what Taiwan’s healthcare system would have looked like absent the policy change, is the “Synthetic Control Method.” It works in the following way: consider Taiwan in the time period before their 1995 healthcare reform. Selecting several control countries whose life expectancy data, when combined, follow Taiwan’s data quite precisely for the years prior to 1995, we could expect them to continue to do so afterwards. Only the real Taiwan data will have the effect of the 1995 healthcare reform. Therefore, the difference we observe in outcomes between the synthetic group and the real Taiwan data can be considered the effect of the healthcare reform. For example, the synthetic group for Taiwan could be made from a weighted average of 40% Japan, 40% China, and 20% the United States, meaning these countries have data that look most like Taiwan from 1960 to 1994. In the post-reform period, keeping those same countries we get data that represent what Taiwan would look like post-1995 which can be compared to Taiwan’s actual data, and we can observe the difference. This method avoids the potential bias of selecting one particular country to judge the size and sign of the healthcare reform’s effect.
We use the post-reform data on the change in life expectancy as one measure of the new program’s impact. The complete dataset includes yearly life expectancy for Taiwan and 187 countries from 1960 to 2016. The basic model considered here takes data from all the available countries to calculate the synthetic control group, or Synthetic Taiwan. The top weights for the Synthetic Taiwan are: Japan 22%, United States 19%, Montenegro 16%, Armenia 9%, Iceland 6%, and others at less than 5%. The list is a mix of intuitive choices for comparisons, as well as some that are not quite as clear. This is the advantage of the Synthetic Control Method: because it is data-driven it chooses the countries that are most similar, and not just those that are perceived as similar.
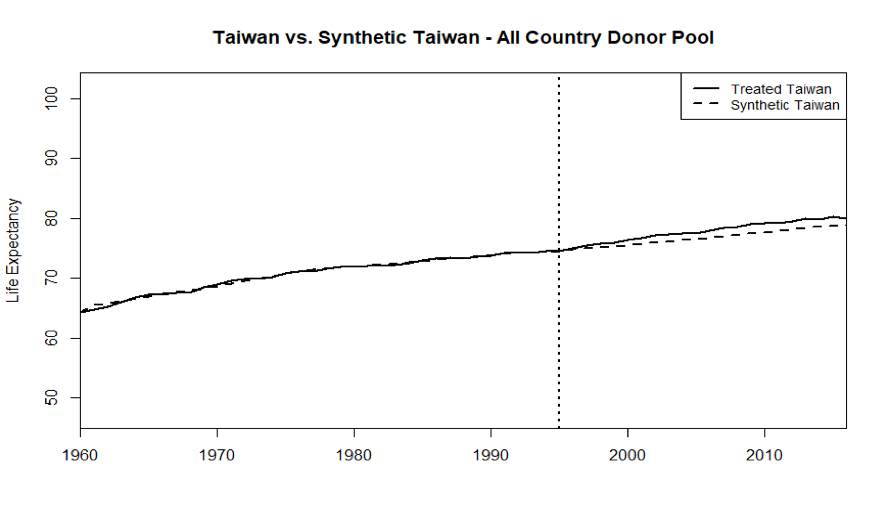 Figure1. Life Expectancy Taiwan and Synthetic Taiwan
Figure 1 shows the output of this basic synthetic control model. The dotted line indicating life expectancy in years in the Synthetic Taiwan sits right on the solid line for Taiwan in the 1960-1994 pre-reform period. That means the country weights described above recreate the real Taiwan quite well. After the 1995 healthcare reform we see a gap emerge as Taiwan’s life expectancy rises faster than in the Synthetic Taiwan. This means Taiwan’s healthcare reform improved life expectancy outcomes relative to what would have happened without the reforms (represented by the synthetic)
Figure2 presents the same information as the figure above, but shows the subtraction of the two lines plotted so the y-axis can be understood as the difference in life expectancy between the actual Taiwan and Synthetic Taiwan. In the 10 years immediately after the policy was implemented, Taiwan improved its life expectancy by roughly a year or more relative to the Synthetic.
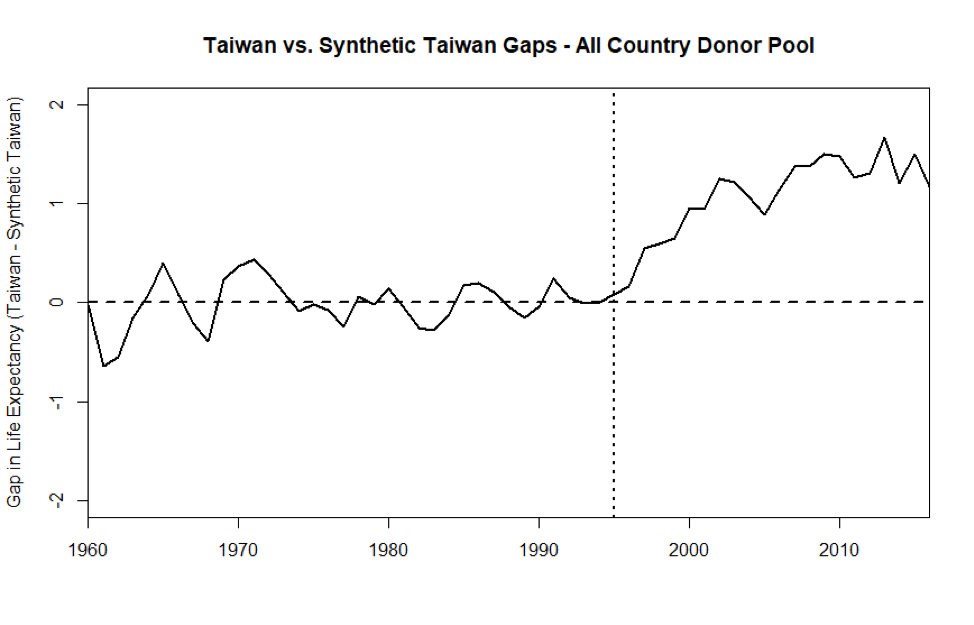 Figure 2. Life Expectancy Gaps Taiwan and Synthetic Taiwan – All Country Donor Pool
Conclusion
Although preliminary, there are some lessons one can potentially take away from our look at Taiwan’s healthcare reform. Often countries are compared without a real reckoning of what those countries were like before reforming their systems nor what would have happened in the absence of a reform. The synthetic control method provides an opportunity to get at the true effect of these differing health system models, assuming no major changes occur in the control group. Here, life expectancy in a synthetic control group keeps very close to the actual life expectancy data in Taiwan in the pre-reform period, but then actual life expectancy immediately and unambiguously moves upwards after the 1995 healthcare reform. Given the results of Taiwan’s move to a single-payer system, there could be real gains in life expectancy, and likely other health outcomes as well.
In an interview with Jonathan Cohn for “The Treatment”, The New Republic’s healthcare blog, Dr. Michael Chen, Vice President and CFO of Taiwan’s National Health Insurance Bureau said:
We sent our people around the world to learn their programs, including the United States. Actually, the program is modeled after Medicare. And there are so many similarities – other than that our program covers all of the population, and Medicare covers only the elderly.
This Taiwan “Medicare For All” example shows potential benefits to other countries of potentially switching to such a system. It was not the case that the people of Taiwan were uniquely healthy, or long-living before the implementation of their new system, so that the reform itself had no effect. It is argued in the U.S., that the U.S. is less healthy due to poverty or obesity not our healthcare system. Given the results shown by Taiwan’s reform, this is not a sufficient explanation: major healthcare reforms can affect health outcomes. Of course, there will be unique challenges if the United States switches to a new healthcare system; Taiwan experienced a spike in administrative costs the first few years, and the U.S. might expect something similar. However, it seems clear from these preliminary results that the U.S. could also reasonably expect some improvements in health outcomes and cost savings after making a switch. Taiwan pays a fraction of the drug prices (for the same drugs) that the U.S. does, pays 6.1% of GDP on healthcare as opposed to 17.2%, pays 0.77% of total healthcare spending on administrative costs compared to 13% in the U.S., and Taiwan visits the doctor at three times the rate of the U.S.; we should learn from Taiwan’s single-payer healthcare reform.


