April 14: The CPI decreased 0.3 percent in March.

The Consumer Price Index for All Urban Consumers (CPI-U) decreased 0.3 percent in March on a seasonally adjusted basis, the U.S. Bureau of Labor Statistics reported today. Over the last 12 months, the all items index rose 2.4 percent before seasonal adjustment. Continue reading.

April 14: The CPI decreased 0.3 percent in March.2017-05-07T00:36:40+00:00

The New York City Labor Market: Recent Developments

James Orr
April 04/Revised April 09, 2017

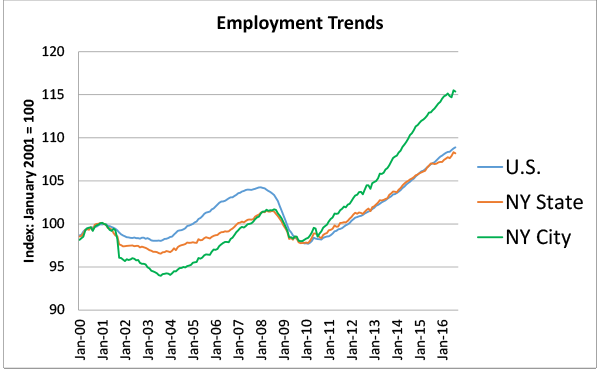
Recently-revised employment data show New York City jobs grew 2.2 percent in 2016, more than 90,000 jobs, well above the national growth rate of 1.8 percent and statewide growth of 1.5 percent.  The relatively strong job performance in the city compared to the nation did not develop recently but has been a consistent feature of the recovery and expansion of employment from its cyclical low in 2010.  The strength of the city’s job growth is even more remarkable in that it contrasts sharply with the considerably deeper decline and slower recovery of employment in the city compared to the nation in the prior cycle.  This post looks at the city‘s job growth following the 2008-2009 downturn and delves further into several labor market developments in the city that have supported, and been supported by, this rapid job growth. 

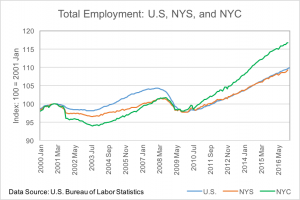
The figure below, adapted from an earlier presentation, presents an index of monthly employment levels from 2000 to 2016 in New York City, New York State and the nation.  Almost from the start of the recovery of jobs in 2010, the job growth rate in New York City exceeded that of the nation and has pushed the level of employment well above both its cyclical low and its peak employment level in the previous cycle.  A measure of overall economic activity in the city also shows a relatively mild downturn and robust recovery beginning in late 2009.  Statewide employment growth has closely matched that of the nation, indicating relatively weaker job performance in other parts of the state.  The upturn is also remarkable in that it reverses the pattern seen in the downturn of the early 2000s.  Then, the city’s employment losses were significantly deeper than that of the nation.  Of course, the 9/11 attack occurred just after the downturn began which further weakened employment in the city’s economy, in general, and  Lower Manhattan in particular.  At that time, a full recovery to pre-downturn levels in the city didn’t occur until almost three years after the nation had recovered.

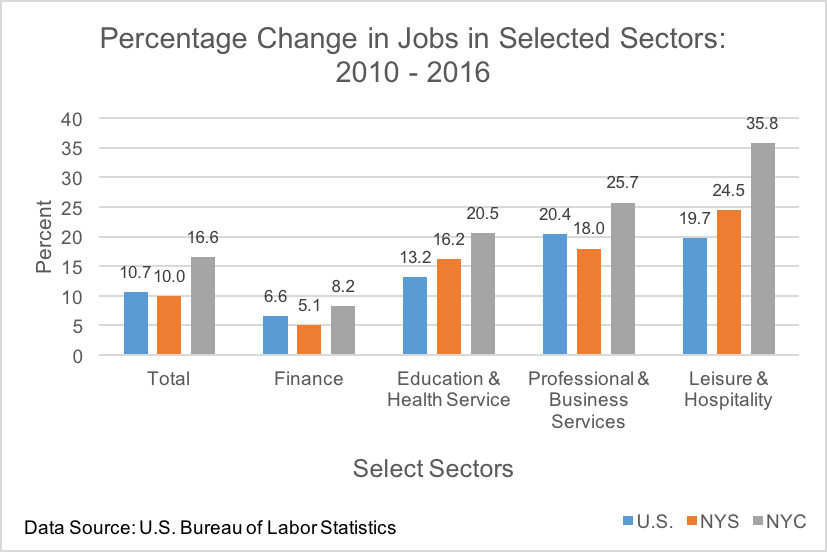
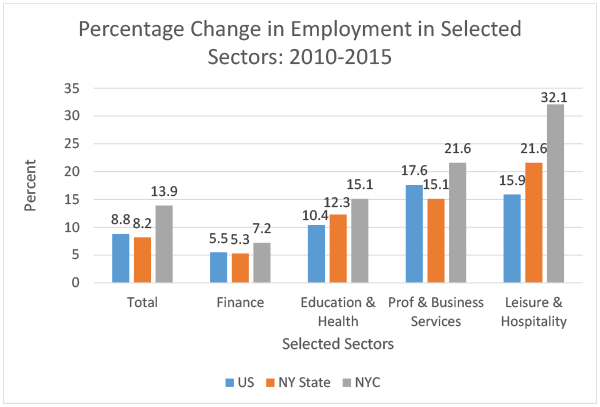
Three significant developments have accompanied this relatively rapid growth of jobs in the city since 2010.  The first is the fact that the expansion of jobs has not been led, as it has been in prior recoveries, by job growth in the city’s key financial sector.  While still a major force in the city’s economy, generating about a fifth of total city earnings, jobs in the sector have increased only modestly over this period, and as a result the finance sector’s share in total employment in the city has declined over the period.  Key sources of growth have been an array of traditional services sectors, including the education and health and leisure and hospitality sectors, which are important sources of employment across the city and where growth has significantly outpaced that of the nation.  Construction and retail trade have also grown fairly robustly in this upturn, and there has been dramatic growth in the city’s tech sector.  While there is no established definition of the component of the tech sector, a recent report aggregated jobs in a number of sectors where the firms used technology as the core of their business strategy.  That report showed that tech jobs defined in this way more than doubled between 2007 and 2014 and contributed significantly to the city’s overall job growth. 

A second development is that from 2010 to 2014 the city’s population expanded 4.6 percent, supported by positive net migration, and the annual average rate of growth was stronger than any seen in the city since the 1920s.  The rapid population growth over this period was also a sizeable increase over the growth rate recorded in the city over the prior decade.  This rapid growth is also consistent with the notion of an increasing attractiveness of urban areas more generally, and recent population growth rates in a number of big cities has been considerably faster than in the prior decade, and earlier, including Los Angeles, Philadelphia, San Francisco, Dallas and Washington, D.C.  

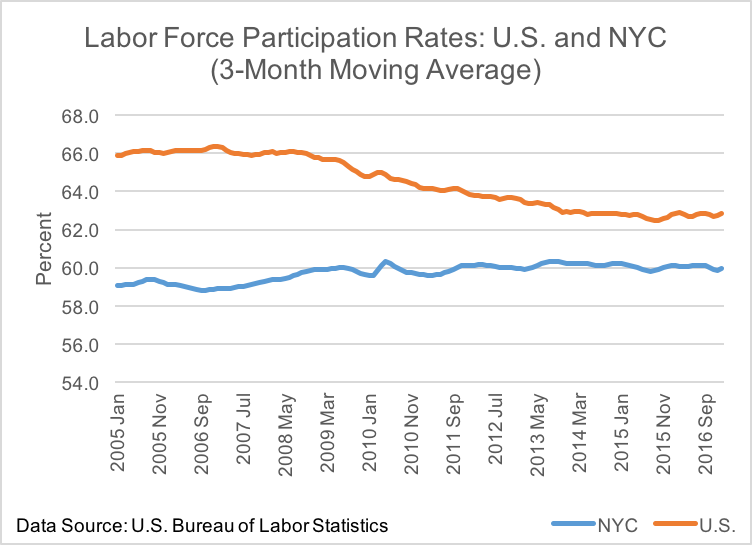
Third, the labor force participation rate in the city has not been declining.  Nationally, the labor force participation rate, or the share of the population that participates in the labor force, has been problematic in this cycle.  On an annual average basis, the rate fell from its pre-recession value of about 66.0 percent to a low of 62.7 percent in 2015 before turning up.  In New York City, the participation rate, while below that of the nation, rose modestly from 59 percent in 2007 to 60 percent in 2010 and then has remained at roughly that rate to the present. Unlike the nation where demographics—the aging of the population—contributed to the declining participation rate, a recent report suggests a key part of the reason for rising labor force participation rates in the city since 2010 is also demographics—the city’s younger population with relatively high rates of labor force participation.

While the high participation in the labor force is encouraging, a measure of how New York residents are faring from the rapid employment growth is the unemployment rate, or the share of the labor force without jobs.  The city’s 5.2 percent average unemployment rate in 2016, though well off its peak rates in 2010, was moderately above the 4.9 unemployment rate in the nation.  Alternative estimates of the underutilization of labor for the nation and New York City are now reported by the U.S. Bureau of Labor Statistics. The broadest of these measures, termed U-6, includes with the unemployed discouraged workers, those who want work but did not actively look in past four weeks and also those who want full-time work but are working part-time for economic reasons.  The 9.6 percent rate in New York City for all of 2016, a similar rate as the nation as a whole, is much higher than the unemployment rate, suggesting there remain residents who can take advantage of a further expansion of job opportunities in the city.        

Looking ahead, several indicators suggest a slowing in the employment expansion in New York City.  While still fairly high, job growth in the city in recent months has slowed from its 2015 pace.  Forecasts of job growth point to a deceleration in 2017 with some heightened policy uncertainty.  Annual job growth rates are projected to continue their decline though they are still expected to be in the range of 0.7 to 1.0 percent in 2020.  It will be important to track the city’s population and labor force trends should an environment of sharply decelerating growth develop.

The New York City Labor Market: Recent Developments2018-07-04T19:37:52+00:00

March 16: Federal Reserve to Raise Fed Funds Target Range to 3/4 to 1 Percent

The FOMC announced that in light of consistent job gains and the unemployment rate remaining unchanged in recent months it would raise the target range for the federal funds rate to 3/4 to 1 percent. The stance of monetary policy remains accommodative, thereby supporting some further strengthening in labor market conditions and a sustained return to 2 percent inflation. Read more


March 16: Federal Reserve to Raise Fed Funds Target Range to 3/4 to 1 Percent2017-03-16T17:55:21+00:00

Two Theses on Health Policy

Paul Krugman
January 10/March 7, 2017

1. There Will Be No Obamacare Replacement
January 10, 2017 9:24 am

You may be surprised at the evident panic now seizing Republicans, who finally — thanks to James Comey and Vladimir Putin — are in a position to do what they always wanted, and kill Obamacare. How can it be that they’re not ready with a replacement plan?

That is, you may be surprised if you spent the entire Obama era paying no attention to the substantive policy issues — which is a pretty good description of the Republicans, now that you think about it.

From the beginning, those of us who did think it through realized that anything like universal coverage could only be achieved in one of two ways: single payer, which was not going to be politically possible, or a three-legged stool of regulation, mandates, and subsidies. Here’s how I put it exactly 7 years ago:

Start with the proposition that we don’t want our fellow citizens denied coverage because of preexisting conditions — which is a very popular position, so much so that even conservatives generally share it, or at least pretend to.

So why not just impose community rating — no discrimination based on medical history?

Well, the answer, backed up by lots of real-world experience, is that this leads to an adverse-selection death spiral: healthy people choose to go uninsured until they get sick, leading to a poor risk pool, leading to high premiums, leading even more healthy people dropping out.

So you have to back community rating up with an individual mandate: people must be required to purchase insurance even if they don’t currently think they need it.

But what if they can’t afford insurance? Well, you have to have subsidies that cover part of premiums for lower-income Americans.

short, you end up with the health care bill that’s about to get enacted. There’s hardly anything arbitrary about the structure: once the decision was made to rely on private insurers rather than a single-payer system

— and look, single-payer wasn’t going to happen — it had to be more or less what we’re getting. It wasn’t about ideology, or greediness, it was about making the thing work.

It’s actually amazing how thoroughly the right turned a blind eye to this logic, and some — maybe even a majority — are still in denial. But this is as ironclad a policy argument as I’ve ever seen; and it means that you can’t tamper with the basic structure without throwing tens of millions of people out of coverage. You can’t even scale back the spending very much — Obamacare is somewhat underfunded as is.

Will they decide to go ahead anyway, and risk opening the eyes of working- class voters to the way they’ve been scammed? I have no idea. But if Republicans do end up paying a big political price for their willful policy ignorance, it couldn’t happen to more deserving people.

2. A Plan Set Up To Fail
March 7, 2017 9:01 am

So now we know what Republicans have to offer as an Obamacare replacement. Let me try to avoid value judgments for a few minutes, and describe what seems to have happened here.

The structure of the Affordable Care Act comes out of a straightforward analysis of the logic of coverage. If you want to make health insurance available and affordable for almost everyone, regardless of income or health status, and you want to do this through private insurers rather than simply have single-payer, you have to do three things.

  • Regulate insurers so they can’t refuse or charge high premiums to people with preexisting conditions
  • Impose some penalty on people who don’t buy insurance, to induce healthy people to sign up and provide a workable risk pool.
  • Subsidize premiums so that lower-income households can afford insurance.

3. Subsidize premiums so that lower-income households can afford insurance

So that’s Obamacare (and Romneycare before that): regulation, mandates, and

subsidies. And the result has been a sharp decline in the number of uninsured, with costs coming in well below expectations. Roughly speaking, 20 million Americans gained coverage at a cost of around 0.6 percent of GDP.

Republicans have nonetheless denounced the law as a monstrosity, and promised to replace it with something totally different and far better. Which makes what they’ve actually come up … interesting.

For the GOP proposal basically accepts the logic of Obamacare. It retains insurer regulation to prevent exclusion of people with preexisting conditions. It imposes a penalty on those who don’t buy insurance while healthy. And it offers tax credits to help people buy insurance. Conservatives calling the plan Obamacare 2.0 definitely have a point.

But a better designation would be Obamacare 0.5, because it’s really about replacing relatively solid pillars with half-measures, severely and probably fatally weakening the whole structure.

First, the individual mandate – already too weak, so that too many healthy people opt out – is replaced by a penalty imposed if and only if the uninsured decide to enter the market later. This wouldn’t do much.

Second, the ACA subsidies, which are linked both to income and to the cost of insurance, are replaced by flat tax credits which would be worth much less to lower-income Americans, the very people most likely to need help buying insurance.

Taken together, these moves would almost surely lead to a death spiral. Healthy individuals, especially low-income households no longer receiving adequate aid, would opt out, worsening the risk pool. Premiums would soar – without the cushion created by the current, price-linked subsidy formula — leading more healthy people to exit. In much of the country, the individual markets would probably collapse.

The House leadership seems to realize all of this; that’s why it reportedly plans to rush the bill through committee before CBO even gets a chance to score it.

It’s an amazing spectacle. Obviously, Republicans backed themselves into a corner: after all those years denouncing Obamacare, they felt they had to do something, but in fact had no good ideas about what to offer as a replacement. So they went with really bad ideas instead.

Two Theses on Health Policy2018-07-04T19:37:52+00:00

March 10: Payroll Employment Rises by 235,000 in February

U.S. Bureau of Labor Statistics
March 10, 2017

Total non-farm payroll employment increased by 235,000 in February, and the unemployment rate was little changed at 4.7 percent. Employment gains occurred in construction, private educational services, manufacturing, health care, and mining. Read more

March 10: Payroll Employment Rises by 235,000 in February2017-03-12T00:48:51+00:00

February 22: Federal Reserve to Maintain Fed Funds Target of 1/2 to 3/4 Percent

The FOMC holds eight regularly scheduled meetings during the year and other meetings as needed. The minutes of regularly scheduled meetings are released three weeks after the date of the policy decision. In the February 1 meeting, the Committee decided to maintain the target range for the federal funds rate at 1/2 to 3/4 percent. The stance of monetary policy remains accommodative, thereby supporting some further strengthening in labor market conditions and a return to 2 percent inflation. Read more

February 22: Federal Reserve to Maintain Fed Funds Target of 1/2 to 3/4 Percent2017-03-12T00:48:20+00:00

Learning about Tax Policy: Business Losses and Corporate Form

Timothy Goodspeed
January 06, 2017

The revelation of the first page of Donald Trump’s 1995 tax return during the 2016 election campaign by the NY Times created a large controversy. At first glance the public may wonder about two issues: (1) why does the tax code allow a company’s losses to be carried over to other years, and (2) why does our tax system allow business losses to appear on a personal income tax return? The answers raise some fundamental issues in tax design.

Why are companies allowed to carryover losses from one year to the next?

The US tax code has for a long time allowed a company’s losses to be spread over many years to calculate its annual taxable income. Current law allows a company’s losses to be carried forward or backward. These carrybacks and carryforwards can be up to 20 years total (from 2 years back and up to 20 years forward; state rules differ as well). They are commonly used by companies that have losses in a given year. Indeed, Table 1 shows that the tax code of most countries allows for some redistribution of losses across years, often with carryforwards more generous than the US. The first question is why would the tax code allow a company’s losses to be shifted through time by carrybacks and carryforwards?

Part of the answer is that taxes are calculated on an annual basis but companies make purchases of equipment or other expensive investments that are geared towards generating a stream of revenue over many years. The large upfront costs may themselves lead to losses in the initial years after the purchase and/or the revenue stream from the investment may be variable.

The company makes the investment because it believes that over time the accumulated revenue will add up to more than the initial capital expense and positive profits will be generated. One question then is how to match up the initial expenses of the capital equipment with the stream of revenue that it produces in the future on an annual basis so that profits can be taxed annually. If a business is making positive profits we use capital depreciation rules which allow a firm to deduct a certain amount of its capital equipment each year over the life of the equipment. However, if a firm is making a loss, it will not have any income to tax so any deduction in that year would be worthless. Allowing loss deductions to be spread over time is a common method used to overcome this problem.

Table 1: Net Operating Loss Carryback and Carryforward Rules around the World

Country Loss Carry-back Loss carry-forward
Australia No Indefinite
Austria No Indefinite
Canada 3 years 20 years
Denmark No Indefinite
France 3 years Indefinite
Germany 1 year Indefinite
Ireland 1 year Indefinite
Italy No 5 years
Mexico No 10 years
Netherlands 1 year 9 years
New Zealand No Indefinite
Norway No Indefinite
Spain No 15 years
Sweden No Indefinite
Switzerland No 7 years
United Kingdom 1 year Indefinite (against profits of the same trade)
United States 2 years 20 years


Source: OECD (2011) Corporate Loss Utilisation through Aggressive Tax Planning, OECD Publishing.

How can business losses show up on a personal tax return?

The second issue is why Donald Trump’s loss appears on his personal tax form. The US tax code allows a company to be set up in several different forms that have different tax and legal consequences. Before 1958 there were essentially two options: set up as a C-corporation with limited liability or set up as a sole proprietor or partnership without limited liability. C-corporation profits are taxed twice, however, once at the corporate level and then again at the personal level. Taxes on the sole proprietor or partnership are only imposed once, at the individual level. These latter organizations are known as “pass-through” entities since their income passes through to the ultimate owner for tax purposes. A third type of pass-through entity, the S-corporation, was established by Congress in 1958 to try to allow small (often family) businesses to benefit from limited liability and at the same time be taxed only once at the individual level. Use of the S-corporate form has restrictions, though; for instance the number of shareholders is limited (currently no more than 100 and more restricted in earlier years).

The integration of the personal and corporate tax systems is often sought after to eliminate the double taxation of corporate income. Countries use different methods to achieve this but many allow a credit of corporate taxes when individuals receive income from a corporation. Pass-through entities (S-corporations, partnerships, and sole proprietorships) result in a partial integration of the personal and corporate tax codes in the US, but also provide avenues for tax avoidance and have implications for the overall equity of the tax system.

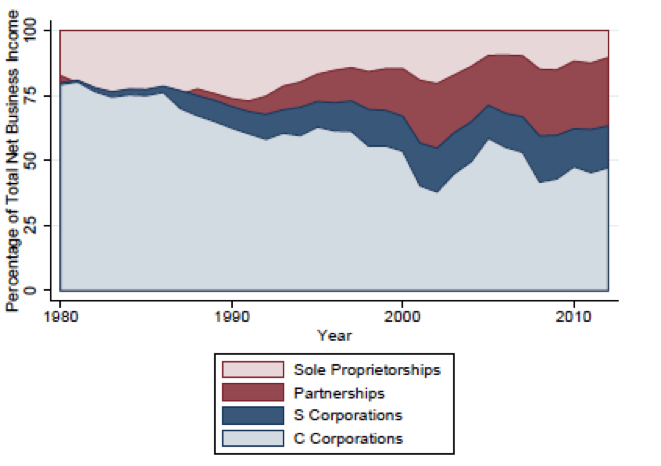
As chart 1 shows, pass-through entities as a form of business organization are of growing importance in the US. A substantial expansion of pass-through entities occurred after the 1986 Tax Reform Act but has accelerated in recent years. In 1985 S-corporations numbered 725,000 with about 4 percent of business net income; today they number over 4 million with almost 15 percent of business net income. Even faster growth occurred in partnerships. The partnership share of net business income rose from a bit over 2 percent in 1980 to 26 percent in 2012.

Chart 1: The Growth of Pass-Through Entities in the US 1980-2012


 Source: Cooper, McClelland, Pearce, Prisizano, Sullivan, Yagan, Zidar, Zwick  “Business in the United States: Who Owns it and How Much Tax Do They Pay?” in Tax Policy and the Economy, Cambridge: MIT Press, Vol 30: 90-128, Brown. 2016, (data from DeBacker and Prisizano, “The Rise in Partnerships,” Tax Notes, June 29, 2015, p. 1563).

Future Tax Policy Changes?

As Donald Trump enters office, tax policy change is high on the agenda. Proposals are on the table to reform our corporate, international, and individual tax systems. However, the new policies turn out, they will be sure to have a large impact on companies, employment, wages, income distribution, and economic growth.

Learning about Tax Policy: Business Losses and Corporate Form2018-07-04T19:37:52+00:00

A Primer on Brexit

Merih Uctum
December 20, 2016

In a referendum on June 23, 2016 Britain voted to leave the European single market paving the way to further turmoil in Europe. This note summarizes why this happened and the implications for Britain when it pulls out.

A brief historical background:

  • European Economic Community (EEC), a free trade area, was established in 1958. Members agreed to a common external tariff on all goods entering the union and comply with common, harmonized rules and standards. The UK joined the EEC in 1973.
  • In 1993 the European Single Market, or the European Union (EU), was completed upon the four-freedoms: freedom of movement of goods, services, capital and people. Britain was among the EU’s founding members.
  • In 1999 a subset of the EU members adopted the euro, the single currency, establishing the European Monetary Union (EMU). Britain did not join it. Access to the single market imposes a variety of rules of engagement involving labor laws, immigration rules, common regulations and standards, which restrain local sovereignty. The relationship of Britain with the EU was difficult and tensions culminated in the vote for Brexit.


Main arguments of the leavers:

(i) Britain will save on the 350 million pounds it sends every week; (ii) Without EU’s burdensome regulations, British companies will be more competitive outside EU; (iii) Britain will be able to control its immigration from the EU, which is the most central issue in the Brexit debate based on the belief that EU migrants are taking jobs from the locals and exploit the country’s benefit system.

A fairly short time table:

According to the Lisbon Treaty, any member can withdraw from the EU unilaterally by invoking Article 50, which Britain announced it will do in spring of 2017. The withdrawal will become effective within two years, during which Britain will engage in negotiations with its partners to secure alternative arrangements.  These treaties have to be approved with unanimity in the Council of Europe and ratified by each of the remaining 27 EU member states.

     The government is expected to opt for a Hard Brexit, involving departure from the EU, the customs union, the single market and reaching free trade agreements with each partner. In a Soft Brexit, it would leave parts of the single market, subject to uncertain negotiations with the EU.

Impact on trade for Britain of a Hard Exit

Trade has two components: goods and services. Both have to be addressed to answer this question:

(i) Trade in goods with the EU

This component makes up about half Britain’s trade volume and over 4 million British jobs depend on exports to the EU. The leavers argue that the EU sells as much to Britain, so there is room for fruitful negotiations.  But disentangling from the current arrangements is very difficult:

  • Today trade in goods depends on complex cross-border supply chains, and final goods have more than one origin. Leaving the EU will take Britain out of these supply chains.
  • To prevent goods of third-party countries entering the bloc by the back door, the EU implements the Rules of Origin principle to all its trading partners in a Free Trade agreement: the partners have to prove that the product is made mostly in the domestic economy. This is a very costly process.

(ii) Trade in services

This component, in particular that in financial services, comprises most of Britain’s interaction with the EU. More than half of the capital market and investment banking revenues generated in the City in 2012 were paid by EU clients. After Brexit, Britain will lose its “passports”, which allow financial services companies licensed in one EU state to provide services across the bloc.  Major US, Japanese and Swiss banks, asset management and insurance companies use the UK as a hub for passporting into other EU markets, where they do not have branches. They are likely to move out. Without passport financial companies need to negotiate bilaterally with individual countries for each service they will sell.

     Absent this system, to operate in the EU without having to establish a subsidiary, non-EU banks and investment firms need to follow “Equivalence rules”, which require their domestic regulations to replicate those in Europe. If domestic regulatory framework is different, each firm has to negotiate with the EU a separate agreement for each service it wants to trade with the union.

     Leavers argue that Britain can reorient its service trade to non-EU countries because trade in services, as opposed to goods, will not involve transport costs. This view is challenged by International Monetary Fund’s finding that increased distance among partners hurts trade in both components because it harms services trade considerably since some services are complementary to goods trade.

Economic cost of a Hard Brexit

Trade with the EU makes up about half of Britain’s trade volume. This compares to 14% to the United States and about 30% to non-EU partners. Estimates of economic costs vary hugely up to 10% of a decline in GDP in 15 years, with a deleterious effect on public finances, social services and investment. The resilience of the economy after the referendum is not indicative of what will happen when Britain triggers Article 50 and adopts the Hard Brexit. Since the referendum Britain is enjoying the privileges of the single market and benefiting from a substantial depreciation of the currency, which provided a considerable competitive edge to British exporters to the EU.

     Limiting EU-originated immigration is estimated to generate a modest increase in wages of medium and higher-income workers and a modest decrease in wages of low-income workers. A slowdown of the economy is expected to hurt employment more. Moreover, disappearance of EU subsidies to farmers will depress earnings in agriculture and will represent a political challenge.

     Leavers argue that deregulation will help the economy because it will increase productivity and therefore output growth.  However, the UK has already one of the lighter regulated economies and the EU rules are similar to international standards that any non-EU country should be implementing. In addition, after the 2008 crisis to calm the voters’ anger the UK had itself tightened its rules.  Thus, any productivity gain due to deregulation would be negligible. The loss from potentially decreased trade is more likely to lower productivity gains acquired in the last decade.

Alternative models that can replace the Single Market

  • World Trade Organization, WTO, rules set tariffs on goods and services traded worldwide and create a restricted market access for trade in goods.
  • Free Trade agreement (Example Canada-EU) eliminates all tariffs between partners. It takes a long time to establish and is subject to the costly “Country of Origin” rule.
  • European Economic Area, EEA (Norway/Iceland/Liechtenstein) allows countries access to the single market but also binds them, without any say in the matter, by the EU single market rules and regulations and makes them contribute to the EU budget. This is an option contradicting the Brexit spirit that seeks to move out of the EU’s regulatory environment.
  • Switzerland-style deal is similar to the EEA rules but with more flexibility. Bilateral agreements allow Switzerland to pick and choose the areas of the union they want to participate and the rules they want to follow. It requires constant renegotiations. It is not clear that the EU will accept the Swiss vote to limit EU immigration.
  • EU banking union allows passporting for financial services if financial institutions abide by the regulations of the European Banking Authority and the Single Supervisory Mechanism, and if the UK allows free labor mobility in financial services.

Britain is moving towards uncharted waters and the government does not appear to have a plan of action.   The economic and political implications for the country and Europe can be substantial.

A Primer on Brexit2018-07-04T19:37:52+00:00
Go to Top