July 26: New York State GDP Expanded by 0.3 Percent in Q1

New York State GDP expanded by 0.3 percent at a seasonally adjusted annual rate in the first quarter of 2017. This growth rate roughly matches the 0.4 percent rate recorded in the fourth quarter of 2016, but is below the 1.4 percent GDP growth rate recorded nationwide in the first quarter of 2017. Read more

July 26: New York State GDP Expanded by 0.3 Percent in Q12017-08-18T18:03:40+00:00

July 20: Total Employment in New York State in June Was up 1.7 Percent from a Year Ago

Total employment in New York State in June was up 1.7 percent from a year ago, supported by the 2.3 percent year-over-year job growth rate in New York City.  The state and city job growth rates were both above the 1.5 year-over-year percent growth in jobs nationwide The state’s 4.5 percent unemployment rate in June roughly matched the 4.4 percent nationwide unemployment rate. Read more

July 20: Total Employment in New York State in June Was up 1.7 Percent from a Year Ago2017-08-18T18:04:55+00:00

A Finger Exercise on Hyperglobalization

Paul Krugman
July 11, 2017

The days when surging world trade was the big story seem like a long time ago. For one thing, trade has stopped surging, and seems to have plateaued. For another, we have faced more pressing issues, like financial crisis.

But I recently gave a presentation on trade issues, have been playing around with them again, and anyway want to take occasional breaks from the headlines. So I find myself trying to find simple ways to talk about “hyperglobalization,” the surge in trade from around 1990 to the eve of the Great Recession. None of the underlying ideas is new, but maybe some people will find the exposition helpful.

The idea here is to think about the effects of transport costs and other barriers to trade pretty much the same way trade economists have long thought about “effective protection.” 

This concept was introduced mainly as a way to understand what was really happening in countries attempting import-substituting industrialization. The idea was something like this: consider what happens if a country places a tariff on car imports, but not on imports of auto parts. What it’s really protecting, then, is the activity of auto assembly, making it profitable even if costs are higher than they are abroad. And the extent to which those costs can be higher can easily be much bigger than the tariff rate.

Suppose, for example, that you put a 20% tariff on cars, but can import parts that account for half the value of an imported car. Then assembling cars becomes worth doing even if it costs 40% more in your country than in the potential exporter: a nominal 20% tariff becomes a 40% effective rate of protection.

Now let’s switch the story around, and talk about a good an emerging market might be able to export to an advanced economy. Let’s say that in the advanced country it costs 100 to produce this good, of which 50 is intermediate inputs and 50 assembly. The emerging market, we’ll assume, can’t produce the inputs, but could do the assembly using imported inputs. There are, however, transport costs – say 10% of the value of any goods shipped.

If we were talking only about trade in final goods, this would mean that the emerging market could export if its costs were 10% less – 91, in this case. But we’ve assumed that it can’t do the whole process. It can do the assembly, and will if its final costs including inputs are less than 91. But the inputs will cost 55 because of transport. And this means that to make exporting work it must have cost less than 91-55=36, compared with 50 in the advanced country.

That is, to overcome 10% transport costs this assembly operation must be 28% cheaper than in the advanced country.

But this in turn means that even a seemingly small decline in transport costs could have a large effect on the location of production, because it drastically reduces the production cost advantage emerging markets need to have. And it leads to an even more disproportionate effect on the volume of trade, because it leads to a sharp increase in shipments of intermediate goods as well as final goods. That is, we get a lot of “value chain” trade.

This, I think, is what happened after 1990, partly because of containerization, partly because of trade liberalization in developing countries. But it’s also looking more and more like a one-time thing.

A Finger Exercise on Hyperglobalization2018-07-04T19:37:51+00:00

July 7: Total Employment Increased, but the Unemployment Rate Ticked up to 4.4 Percent

Total nonfarm payroll employment increased by 222,000 in June, and the unemployment
rate was little changed at 4.4 percent, the U.S. Bureau of Labor Statistics reported
today. The unemployment rate ticked up as more Americans rejoined the workforce. Employment increased in health care, social assistance, financial activities,
and mining. Continue Reading


July 7: Total Employment Increased, but the Unemployment Rate Ticked up to 4.4 Percent2017-07-07T15:21:32+00:00

The United States, Mexico, and NAFTA

The Economic Studies Group
Jun 28, 2017

The terms of current and proposed U.S. trade agreements are getting renewed attention as to their impacts on the U.S. economy and workforce.  Recently, U.S. trade with Mexico has become a particular focus for reconsideration as trade between the two countries has grown remarkably since the 1994 passage of the North American Free Trade Agreement (NAFTA), and reaching agreement on the benefits and costs of NAFTA has been hard.

Most of the recent discussion centered around the impact of trade on the loss of U.S. jobs in manufacturing.  While the factors causing this outcome are diverse and not limited to NAFTA, ranging from globalization and automation to monetary and fiscal policies, the argument leaves out the benefits that are derived from trade with Mexico   Several features of U.S.-Mexico trade flows were noted in a recent analysis of the U.S-Mexico trade relationship by the Trade and NAFTA Office of the Ministry of the Economy of Mexico, and could warrant consideration in any review of NAFTA.  In this post, we highlight four of the features of that analysis: the intra-industry nature of goods trade, the U.S. surplus in services trade, the specialization in agricultural trade and the geographic concentration of the importance of Mexico to state exports.   Each of these presents an aspect of U.S.-Mexico trade that is related to the potential benefits and costs of a renegotiated agreement.

U.S. trade with Mexico has grown dramatically since the passage of NAFTA.  The figure below shows roughly balanced trade in 1994 totaling $100 billion expanding to $525 billion by 2016 and with a bilateral deficit of about $63 billion.  With $1.5 billion dollars in products traded bilaterally each day, Mexico has become the third largest partner and the second largest export market for the U.S., and the second largest supplier of imports. 

A closer look at the trade flows indicates that trade has strengthened supply chains in key industries, particularly autos and electronics.


These intermediate goods also comprise a large share of Mexico’s exports to the U.S., though there is a larger component of finished goods.  These bilateral trade flows further indicate that U.S.-Mexico trade reflects the expanding supply chain between manufacturers in the two countries.


More generally, U.S, exports to Mexico consist largely of intermediate goods or products that are used as inputs into the manufacturers in the two countries.  In fact, it has been estimated that there is 40 percent value added by U.S. producers in Mexico’s exports, a figure much larger than that for other suppliers.


U.S. – Mexico trade in services has also expanded greatly since the 1990s.  Much of that trade is in the area of travel and transportation, rough 65 to 70 percent, but there is also trade in telecommunications and financial services.  And similar to overall U.S. trade flows, the U.S. maintains a surplus in services trade with Mexico.


Trade in agricultural products between the two countries is also large, with the U.S. exporting about $18 billion worth of products to Mexico and importing almost $25 billion worth of products from Mexico annually.  The composition of this trade reflects the resources of the two countries.  A look at the 2016 trade figures below shows, U.S. exports consist of meats, dairy products, grains, and oilseeds while U.S. imports comprise a large amount of fruits, vegetables, and beverages.


The concentration of U.S. goods exports to Mexico in autos, electronics, and other intermediate inputs together with these agricultural exports of U.S. staples suggests an uneven geographic pattern of the source of these exports.  The figure below looks at states and shows that Mexico is an important export market for the four border states, and South Dakota, Nebraska, Iowa, Missouri, and Kansas in the Midwest, and Michigan, and Mexico ranks among the second and third largest export markets for 21 additional states.


The data on trade flows between the U.S. and Mexico suggest that the economic relationship between the two countries has several specific features that should be considered in the discussion of a renegotiation of NAFTA.  The evolution of goods trade into a large component that reflects supply chains within manufacturing firms and industries could be costly to break.  The composition of trade in agricultural products and services actually suggests a more typical pattern of trade observed with other countries.   So, it is really with regard to goods trade that negotiators need to bear in mind that the composition of trade flows reflects the evolution of intra-firm and inter-industry relationships that have developed over time.     

The United States, Mexico, and NAFTA2018-07-04T19:37:51+00:00

June 14: Federal Reserve to Raise Fed Funds Target Range to 1 to 1.25 Percent

In view of realized and expected labor market conditions and inflation, the Committee decided to raise the target range for the federal funds rate to 1 to 1-1/4 percent. The stance of monetary policy remains accommodative, thereby supporting some further strengthening in labor market conditions and a sustained return to 2 percent inflation. Read more

June 14: Federal Reserve to Raise Fed Funds Target Range to 1 to 1.25 Percent2017-06-14T20:54:04+00:00

How Important is the Finance Sector to the New York City Economy?

James Orr
Jun 09, 2017

Finance has long been considered a key sector in the New York City economy.  The sector generates about 30 percent of the earnings of workers throughout the city, and thus developments in the sector are critically important for the performance of the overall city economy.   This post reviews the recent changes in the sector in New York City, particularly the securities segment, and discusses some of the ongoing challenges faced by the city as a host to financial firms.

The finance sector, formally labeled Finance and Insurance, consists of four major industries: Credit Intermediation (informally banking), Securities, Commodity Contracts and other Financial Investments (the securities sector or Wall Street), Insurance, and Funds, Trusts and Other Financial Vehicles.  In terms of jobs, the sector employs about 460,000 workers, a little less than 10 percent of city employment, with banking and securities comprising about three-fourths of the jobs with the sector.

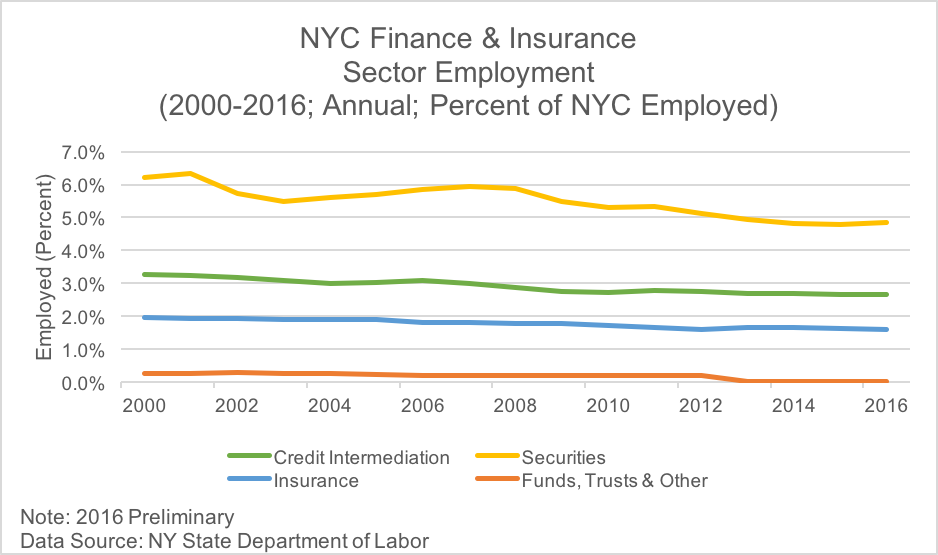
Since 2000, employment in the Finance and insurance sector in New York City has declined in absolute terms by about 30,000 jobs.  As seen in the chart below, the share of total city employment in securities fell from over six percent to a little under five percent, while the shares of employment in the other sub-sectors declined only modestly over the period.  Many factors underlie this absolute and relative decline in jobs, principal among them are the long-term trend in the outmigration of relatively low value-added activities across the sector to cheaper alternative locations,  the increasing use of technology in providing financial services and, most recently, the strong expansion of jobs in non-financial industries in the city, such as health and education, tourism, and professional and business services.  The figure also indicates a decline in the share of employment in the securities industry in the two years following the 9/11 attack in 2001 and for several years following the financial crisis in 2008.   In neither case did the sector fully recover its prior peak employment share. 

Despite what appears as a relatively moderate and declining share of employment, the importance of the finance sector, and the securities industry, in particular, arises mainly from its role in generating income.  The figure below shows that the four segments making up the finance sector accounted for about 30 percent of total city earnings.  And the securities industry’s share of total income is on the order of 20 percent–one in every five dollars of income earned in the city.  The annual average salary in the industry is currently about $375,000.  

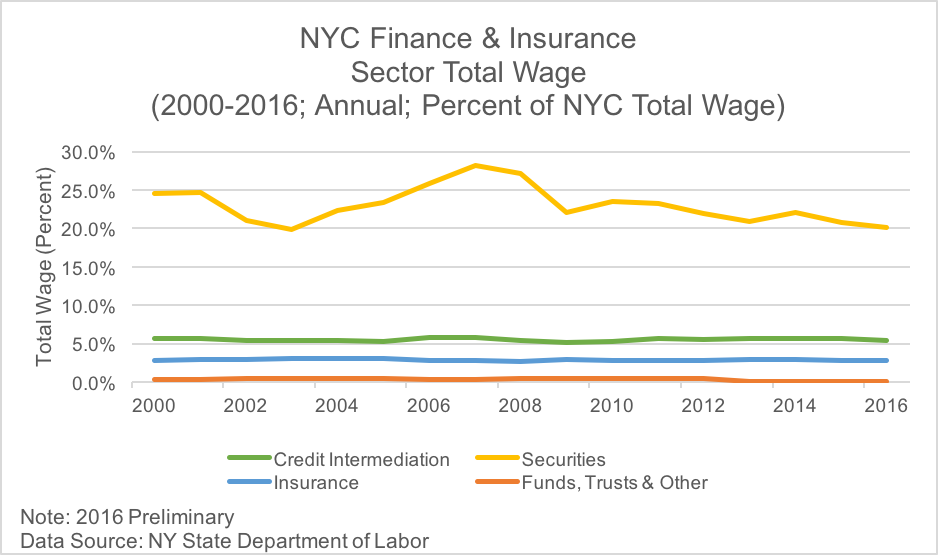
The figure also highlights the cyclical variability in the income share, a result of the importance of the annual performance-driven bonus payments made in the industry.  A recent report on the securities industry pointed to this variability by showing that the cash bonus pool in 2006 was almost $35 billion and the average annual bonus reach $190,000; in 2008, the cash bonus pool had declined to $17 billion and the average annual bonus was just over $100,000.    This variability is linked to the importance of the industry in the city, in fact, since the mid-1960s through the recent financial crisis, the ups and downs in total employment in the city have been led by the ups and downs in employment in the securities industry. 

Forecasts show job growth in the securities industry slowing moderately to about 0.5 percent annually over the next several years, and wage growth slowing to about 1.4 percent.  The outlook also has a number of associated risks that potentially weigh heavily on the performance of the sector and, as a result, the city’s economy.  Two factors are related to the nature of the activities carried out by financial firms.  One is the new regulatory environment that followed the financial crisis in 2008, particularly the changes to the allowable investment activities under the Dodd-Frank Act (Dodd-Frank Wall Street Reform and Consumer Protection Act).  These changes are being implemented even as there are suggestions that a number of the Act’s provisions might be softened.  Any new legislation would carry implications for the activities, employment, and profitability in the sector.  A second is the link of the performance of the sector to overall macroeconomic conditions.  A recent report points out that the major income-generating activities in financial firms in New York City are linked to Initial Public Offerings (IPOs), mergers and acquisitions (M&As), and asset management.  A slowing economy or significantly tightened financial environment could limit these kinds of activities. 

Another risk factor is the need for ongoing efforts to keep New York City as an attractive location for major financial firms.  Several states, including California, Texas, New York and Florida, have a large financial sector whose growth in the past five years has matched or exceeded that of New York City.  These new clusters could be attractive to New York City or other financial firms seeking lower labor and land costs.  Moreover, the city has faced a number of challenges over the past twenty years, such as the 9/11 attack and Superstorm Sandy.  These events point to a need for continual monitoring of conditions that influence how financial firms think about locating and growing their business in New York City.


How Important is the Finance Sector to the New York City Economy?2018-07-04T19:37:51+00:00
Go to Top