Meng-Ting Chen and James Orr
December 29, 2019
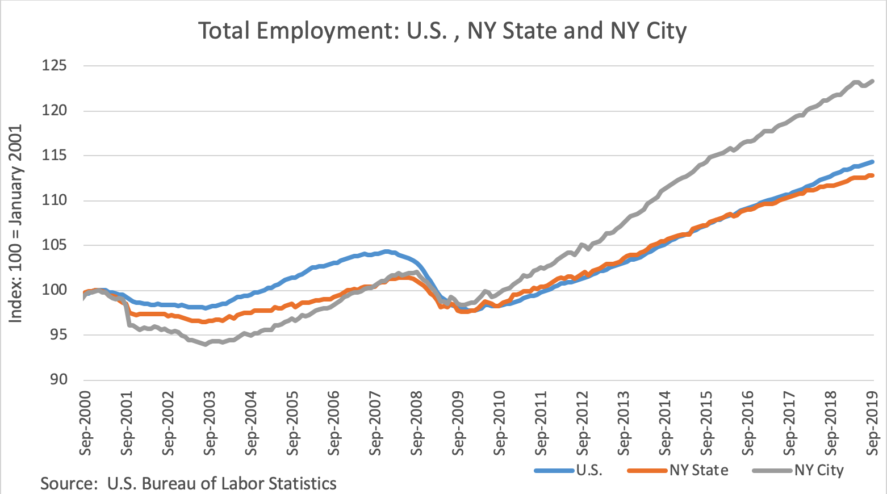
New York City employment is now well into its ninth year of growth and jobs across a variety of sector continue to expand. Data for the third quarter show employment was up 1.6% over the same period last year, down from the stronger third quarter 2018 year-over-year performance but still modestly above the current nationwide employment growth rate. Statewide, jobs are expanding as well though at a much slower pace, continuing the long-standing pattern in the state of a relatively stronger job performance in the city. This post reviews job growth in the New York economy through the third quarter 2019 over a year ago, focusing on the performance of key sectors driving recent New York City’s job growth and highlighting some important influences on the city’s employment growth going forward.
Employment Trends in New York City, New York State and the Nation
The broad trends in employment over the past two decades in New York State, New York City and the nation are shown in the figure below. The monthly indexes the decline and recovery of employment in the early 2000s and then at the time of the financial crisis, and show the subsequent robust recovery and expansion beginning in 2010, also seen here. Job growth continued in the city through September of 2019, though not without some bumps in the second quarter. Employment in the city is now well above its pre-downturn peak.
Third-quarter city job counts were up 71,000 over a year-ago, a gain of 1.6% which, while below its strong 2.1% performance in 2018, was modestly above the national average growth of 1.5%. Statewide job growth has averaged closer to 1.0% over the past year. This ranking of relative growth rates—New York City, the nation, and then New York State—has persisted for several years and reflects the combination of the sustained expansion of jobs in the city and a considerably slower pace of employment growth across the upstate and western New York metropolitan areas.
Performance of Key Industries
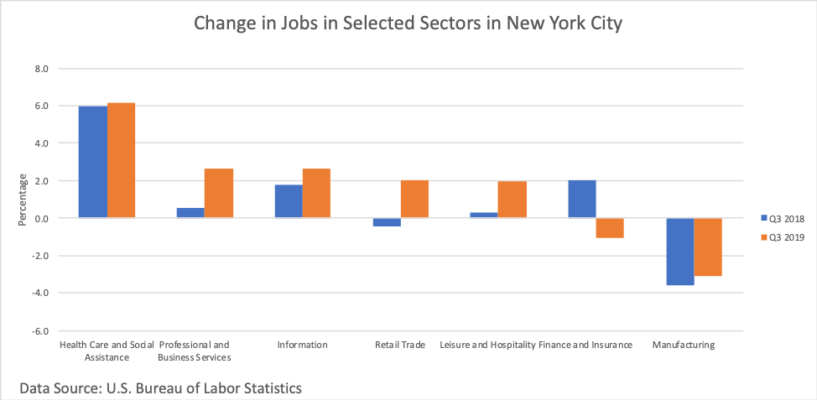
Underlying the overall growth in jobs in New York City over the past year is a diverse performance of its various industries. Here we examine the changes in several industries that are among the key drivers of changes in employment. Our focus is on the percent change in employment in the third quarter of 2019 over a year ago, as shown in the figure.
Healthcare and social assistance accounts for almost 20% of total New York City employment and has been a stable source of new jobs for more than a decade. Over the past year alone jobs expanded by 6.2% in the city, and features of some important healthcare occupations are discussed here. A notable aspect of the growth of employment in the sector, detailed in a recent report, is the surge in job growth in home health-related payrolls, mainly home healthcare services and services for the elderly and disabled. The surge is linked to an expansion of a New York state program, the Consumer Directed Personal Assistance Program (CDPAP), under which the elderly and disabled can choose their own providers, including family members, supported by intermediaries who are paid through Medicaid. The jobs are recorded mainly in two sub-sectors, ambulatory care services, which expanded 9.9% over the year, and social assistance, which expanded 5.1%. Any legislative changes to the program could influence the growth in the sector and the broader city economy going forward.
The information industry includes a range of sub-sectors, including traditional book and newspaper publishing and radio and television broadcasting, movie and video production to the more high-tech software publishing and web search portals. Jobs in the sector have expanded in each year over the past decade and total employment now exceeds 200,000. The professional and business services industry continues to be an important source of job growth. The industry includes three major categories; firms providing a range of professional services, such as accounting, legal, computer, consulting, etc., administrative and support services, and headquarters and corporate offices, and each category saw growth over the past year.
Employment in the retail trade industry increased by about 7,000 jobs over the past year after seeing a slight decline in 2018. Reports have suggested that employment in segments of the sector, particularly department stores, were facing ongoing pressures from the rapid expansion of online shopping, and jobs there have been essentially flat for the past several years. The growth over the past year, however, has been supported by an expansion of jobs in clothing, health and personal care, and food retailers. Employment in the leisure and hospitality industry also bounced back from a weak performance last year with job counts up close to 10,000, and tourism is poised to set a record for visitors this year. Last year’s decline in food service employment was more than offset this year and overall employment in the sector is now close to a record high.
Two industries—finance and manufacturing—saw employment declines over the past year. Employment in the finance industry fell by about 4,500 jobs which offset about half of the prior year’s gain. About two-thirds of the lost jobs this year were in the securities sector (Wall Street). Although that sector accounts for only about 5% of total city employment, its average salary of $422,000 (2017) give it an outsized importance in city earnings. Employment in the sector still remains near its decade high.
While nationwide manufacturing employment began a recovery in 2010, the manufacturing sector in both the state and the city have continued to decline. Over the past year, the city lost about 2,000 jobs, a decline of almost 3%. One notable exception to this statewide trend has been in Albany where the manufacturing sector, while small, has seen employment grow by about 30% over the past decade as a result of the successful development of a nanotechnology cluster.
Some Caveats and the Outlook
Reported job trends help to inform employment forecasts, but like many time series the monthly state and local employment numbers, used here to compute quarterly averages, get revised. This arises because the monthly state and local employment estimates are based on a survey of employers, the Current Employment Statistics (CES) and a more comprehensive accounting of employment is available from official unemployment insurance records is available, the Quarterly Census of Employment and Wages (QCEW), though with a six-month lag. In March of each year, the Bureau of Labor Statistics benchmarks the initially reported state and local employment numbers to the QCEW counts. To anticipate what the revised employment will be prior to the March release, the regular reporting of an early benchmarked series has been undertaken, described here. To date, this series suggests that the level of employment in the city this year is now likely higher than initially reported though there are no significant differences with the reported growth rates.
Some additional context to the reported job growth trends is a study showing the decline in the average workweek in the city’s private sector over the past ten years and continuing in 2019. The average workweek fell from 35.5 hours to 34.1 hours, a decline of 4.1% and more than that in the nation and other large cities. The decline suggests that new private-sector jobs do not all provide full-time employment and indicates that total hours worked, an important determinant of citywide output and earnings, have not expanded as much as employment. As to the causes, the decline reflects, in part, though not entirely, the expansion of employment in industries with typically shorter workweeks, such as health services and leisure and hospitality.
Looking ahead, reports project that job growth in New York City will end the year up close to its current pace. Each sees growth continuing in 2020 though at a slower pace than this year, with estimates from roughly 1.1 – 1.4%. One risk to the outlook is the performance of the national economy, where slower than expected growth would dampen prospects for city firms with close links to national activity. Another risk is more local and arises from the provisions of the 2017 tax bill that caps the size of the individual federal tax deduction for state and local tax payments. One study showed the potential for the bill to raise the cost of homeownership in high tax states like New York. More recently, a report documented an increase in the federal personal income taxes paid by New York residents in 2018, with part of that increase suggested to reflect the limits on deductions. The bill may have other effects as well and it remains to be seen how big and sustained any effects will be in the state and what will be their ultimate economic impacts on the state and city economies.


