The United States, Mexico, and NAFTA

The Economic Studies Group
Jun 28, 2017

The terms of current and proposed U.S. trade agreements are getting renewed attention as to their impacts on the U.S. economy and workforce.  Recently, U.S. trade with Mexico has become a particular focus for reconsideration as trade between the two countries has grown remarkably since the 1994 passage of the North American Free Trade Agreement (NAFTA), and reaching agreement on the benefits and costs of NAFTA has been hard.

Most of the recent discussion centered around the impact of trade on the loss of U.S. jobs in manufacturing.  While the factors causing this outcome are diverse and not limited to NAFTA, ranging from globalization and automation to monetary and fiscal policies, the argument leaves out the benefits that are derived from trade with Mexico   Several features of U.S.-Mexico trade flows were noted in a recent analysis of the U.S-Mexico trade relationship by the Trade and NAFTA Office of the Ministry of the Economy of Mexico, and could warrant consideration in any review of NAFTA.  In this post, we highlight four of the features of that analysis: the intra-industry nature of goods trade, the U.S. surplus in services trade, the specialization in agricultural trade and the geographic concentration of the importance of Mexico to state exports.   Each of these presents an aspect of U.S.-Mexico trade that is related to the potential benefits and costs of a renegotiated agreement.

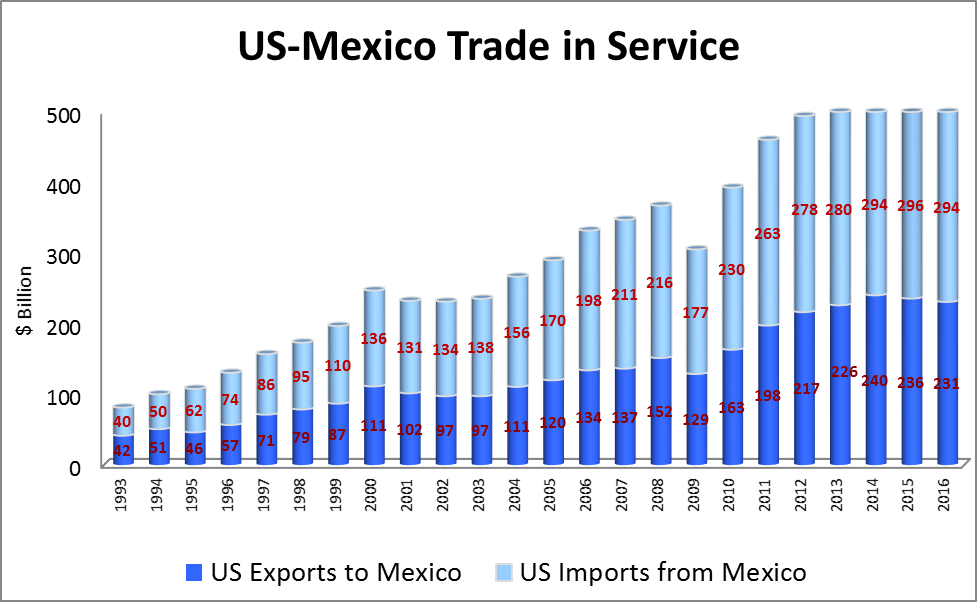
U.S. trade with Mexico has grown dramatically since the passage of NAFTA.  The figure below shows roughly balanced trade in 1994 totaling $100 billion expanding to $525 billion by 2016 and with a bilateral deficit of about $63 billion.  With $1.5 billion dollars in products traded bilaterally each day, Mexico has become the third largest partner and the second largest export market for the U.S., and the second largest supplier of imports. 

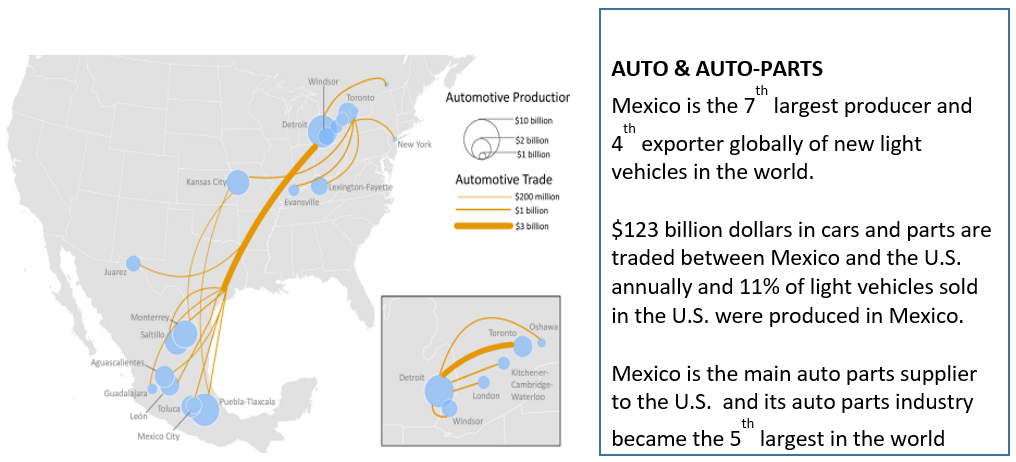
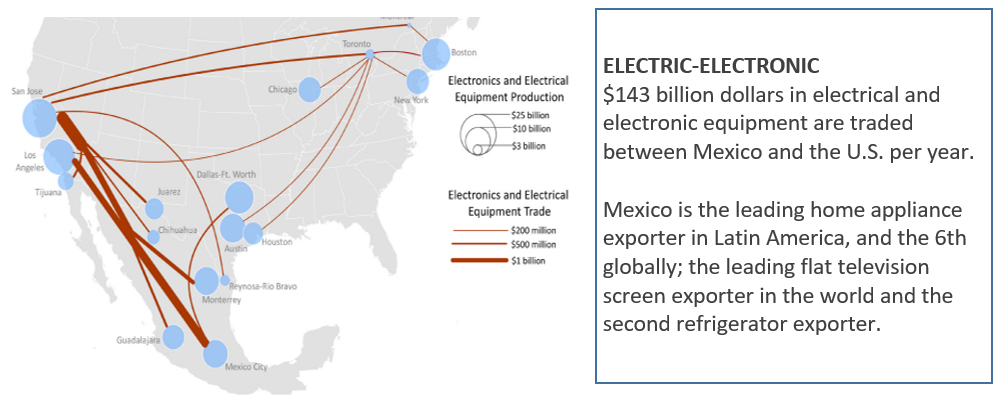
A closer look at the trade flows indicates that trade has strengthened supply chains in key industries, particularly autos and electronics.


These intermediate goods also comprise a large share of Mexico’s exports to the U.S., though there is a larger component of finished goods.  These bilateral trade flows further indicate that U.S.-Mexico trade reflects the expanding supply chain between manufacturers in the two countries.


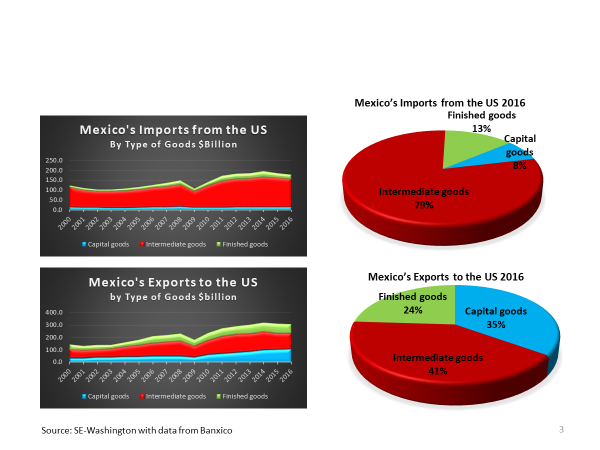
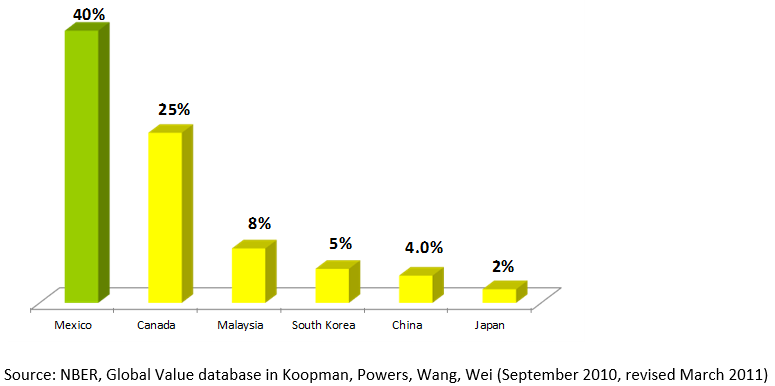
More generally, U.S, exports to Mexico consist largely of intermediate goods or products that are used as inputs into the manufacturers in the two countries.  In fact, it has been estimated that there is 40 percent value added by U.S. producers in Mexico’s exports, a figure much larger than that for other suppliers.


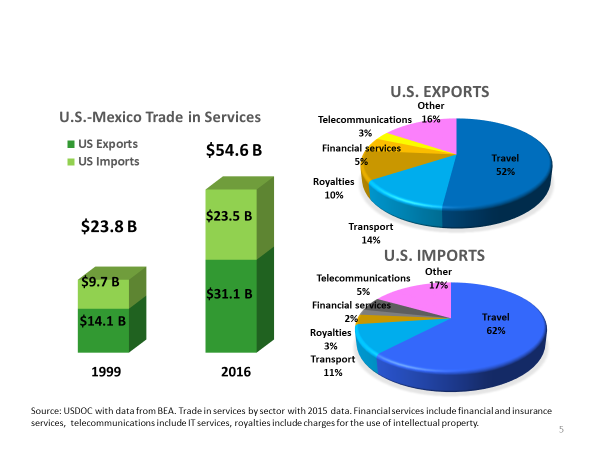
U.S. – Mexico trade in services has also expanded greatly since the 1990s.  Much of that trade is in the area of travel and transportation, rough 65 to 70 percent, but there is also trade in telecommunications and financial services.  And similar to overall U.S. trade flows, the U.S. maintains a surplus in services trade with Mexico.


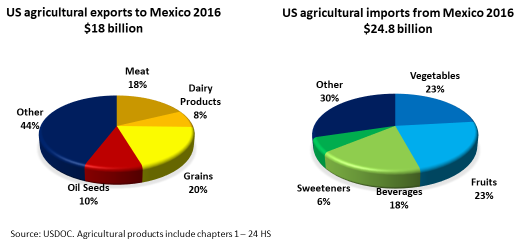
Trade in agricultural products between the two countries is also large, with the U.S. exporting about $18 billion worth of products to Mexico and importing almost $25 billion worth of products from Mexico annually.  The composition of this trade reflects the resources of the two countries.  A look at the 2016 trade figures below shows, U.S. exports consist of meats, dairy products, grains, and oilseeds while U.S. imports comprise a large amount of fruits, vegetables, and beverages.


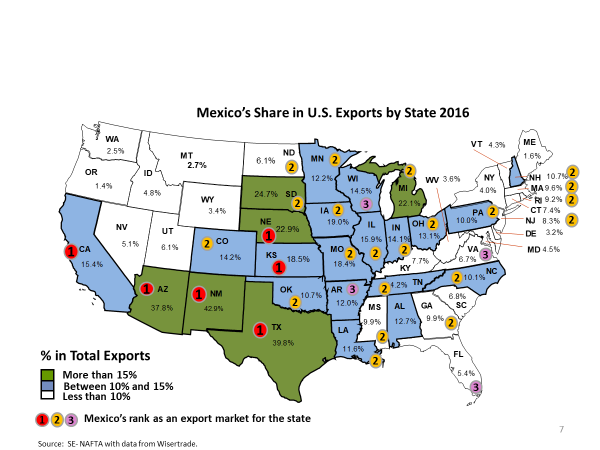
The concentration of U.S. goods exports to Mexico in autos, electronics, and other intermediate inputs together with these agricultural exports of U.S. staples suggests an uneven geographic pattern of the source of these exports.  The figure below looks at states and shows that Mexico is an important export market for the four border states, and South Dakota, Nebraska, Iowa, Missouri, and Kansas in the Midwest, and Michigan, and Mexico ranks among the second and third largest export markets for 21 additional states.


The data on trade flows between the U.S. and Mexico suggest that the economic relationship between the two countries has several specific features that should be considered in the discussion of a renegotiation of NAFTA.  The evolution of goods trade into a large component that reflects supply chains within manufacturing firms and industries could be costly to break.  The composition of trade in agricultural products and services actually suggests a more typical pattern of trade observed with other countries.   So, it is really with regard to goods trade that negotiators need to bear in mind that the composition of trade flows reflects the evolution of intra-firm and inter-industry relationships that have developed over time.     

The United States, Mexico, and NAFTA2018-07-04T19:37:51+00:00

June 14: Federal Reserve to Raise Fed Funds Target Range to 1 to 1.25 Percent

In view of realized and expected labor market conditions and inflation, the Committee decided to raise the target range for the federal funds rate to 1 to 1-1/4 percent. The stance of monetary policy remains accommodative, thereby supporting some further strengthening in labor market conditions and a sustained return to 2 percent inflation. Read more

June 14: Federal Reserve to Raise Fed Funds Target Range to 1 to 1.25 Percent2017-06-14T20:54:04+00:00

How Important is the Finance Sector to the New York City Economy?

James Orr
Jun 09, 2017

Finance has long been considered a key sector in the New York City economy.  The sector generates about 30 percent of the earnings of workers throughout the city, and thus developments in the sector are critically important for the performance of the overall city economy.   This post reviews the recent changes in the sector in New York City, particularly the securities segment, and discusses some of the ongoing challenges faced by the city as a host to financial firms.

The finance sector, formally labeled Finance and Insurance, consists of four major industries: Credit Intermediation (informally banking), Securities, Commodity Contracts and other Financial Investments (the securities sector or Wall Street), Insurance, and Funds, Trusts and Other Financial Vehicles.  In terms of jobs, the sector employs about 460,000 workers, a little less than 10 percent of city employment, with banking and securities comprising about three-fourths of the jobs with the sector.

Since 2000, employment in the Finance and insurance sector in New York City has declined in absolute terms by about 30,000 jobs.  As seen in the chart below, the share of total city employment in securities fell from over six percent to a little under five percent, while the shares of employment in the other sub-sectors declined only modestly over the period.  Many factors underlie this absolute and relative decline in jobs, principal among them are the long-term trend in the outmigration of relatively low value-added activities across the sector to cheaper alternative locations,  the increasing use of technology in providing financial services and, most recently, the strong expansion of jobs in non-financial industries in the city, such as health and education, tourism, and professional and business services.  The figure also indicates a decline in the share of employment in the securities industry in the two years following the 9/11 attack in 2001 and for several years following the financial crisis in 2008.   In neither case did the sector fully recover its prior peak employment share. 

Despite what appears as a relatively moderate and declining share of employment, the importance of the finance sector, and the securities industry, in particular, arises mainly from its role in generating income.  The figure below shows that the four segments making up the finance sector accounted for about 30 percent of total city earnings.  And the securities industry’s share of total income is on the order of 20 percent–one in every five dollars of income earned in the city.  The annual average salary in the industry is currently about $375,000.  

The figure also highlights the cyclical variability in the income share, a result of the importance of the annual performance-driven bonus payments made in the industry.  A recent report on the securities industry pointed to this variability by showing that the cash bonus pool in 2006 was almost $35 billion and the average annual bonus reach $190,000; in 2008, the cash bonus pool had declined to $17 billion and the average annual bonus was just over $100,000.    This variability is linked to the importance of the industry in the city, in fact, since the mid-1960s through the recent financial crisis, the ups and downs in total employment in the city have been led by the ups and downs in employment in the securities industry. 

Forecasts show job growth in the securities industry slowing moderately to about 0.5 percent annually over the next several years, and wage growth slowing to about 1.4 percent.  The outlook also has a number of associated risks that potentially weigh heavily on the performance of the sector and, as a result, the city’s economy.  Two factors are related to the nature of the activities carried out by financial firms.  One is the new regulatory environment that followed the financial crisis in 2008, particularly the changes to the allowable investment activities under the Dodd-Frank Act (Dodd-Frank Wall Street Reform and Consumer Protection Act).  These changes are being implemented even as there are suggestions that a number of the Act’s provisions might be softened.  Any new legislation would carry implications for the activities, employment, and profitability in the sector.  A second is the link of the performance of the sector to overall macroeconomic conditions.  A recent report points out that the major income-generating activities in financial firms in New York City are linked to Initial Public Offerings (IPOs), mergers and acquisitions (M&As), and asset management.  A slowing economy or significantly tightened financial environment could limit these kinds of activities. 

Another risk factor is the need for ongoing efforts to keep New York City as an attractive location for major financial firms.  Several states, including California, Texas, New York and Florida, have a large financial sector whose growth in the past five years has matched or exceeded that of New York City.  These new clusters could be attractive to New York City or other financial firms seeking lower labor and land costs.  Moreover, the city has faced a number of challenges over the past twenty years, such as the 9/11 attack and Superstorm Sandy.  These events point to a need for continual monitoring of conditions that influence how financial firms think about locating and growing their business in New York City.


How Important is the Finance Sector to the New York City Economy?2018-07-04T19:37:51+00:00

May 18th: New York State gains 5,600 jobs in April.

New York State gains 5,600 jobs in April, year-over-year growth at 0.8% (U.S. growth 1.4%).

In April 2017, New York State’s private sector job count increased by 4,700, or 0.1%, to 8,032,300, according to preliminary figures released today by the New York State Department of Labor. Since the end of the State’s recession in late 2009, New York has added more than one million private sector jobs. Continue Reading.

May 18th: New York State gains 5,600 jobs in April.2017-05-26T15:43:12+00:00

May 15: New York State Economy Grew 0.8 Percent in 2016

New York State economy grew 0.8 percent in 2016 following growth of 1.2 percent in 2015.

Real gross domestic product (GDP) increased in every state and the District of Columbia in the fourth quarter of 2016, according to statistics on the geographic breakout of GDP on May 12th by the U.S. Bureau of Economic Analysis. Real GDP by state growth ranged from 3.4 percent in Texas to 0.1 percent in Kansas and Mississippi (table 1 and chart 1). Finance and insurance; retail trade; and professional, scientific, and technical services were the leading contributors to U.S. economic growth in the fourth quarter. Continue Reading.

May 15: New York State Economy Grew 0.8 Percent in 20162018-07-04T19:37:51+00:00

May 15: Business activity leveled off in New York State in May

Business activity leveled off in New York State, according to firms responding to the May 2017 Empire State Manufacturing Survey. The headline general business conditions index fell six points to -1.0. The new orders index dropped to -4.4, suggesting a small decline in orders, and the shipments index edged down to 10.6, indicating that shipments increased at a slightly slower pace than in April. Labor market indicators pointed to a modest increase in both employment and hours worked, and input prices and selling prices rose at a more moderate pace. Continue Reading.

May 15: Business activity leveled off in New York State in May2017-05-18T00:34:15+00:00
Go to Top