Is the New York Economy Slowing Down?

James Orr
October 26, 2017

Recently-released employment figures show the number of jobs in New York State and New York City declined sharply in September: The state lost about 34,000 jobs and about two-thirds of the decline occurred in the city, suggesting a possible slowing of the robust employment picture seen downstate. This post examines these recent job numbers and to what extent there is a suggestion of a cooling off of job growth. It then looks at several services sectors that have been key drivers of job growth over the past year, including one sector–retail trade—where consumer buying trends have been linked to ongoing job losses nationally as well as in the state and city. Looking ahead, the administration’s recently released framework for federal tax reform proposes the elimination of the deductibility of state and local taxes. In light of the relatively large value of these deductions taken by New York residents, the post reviews the evidence regarding how this proposal could affect federal income taxes paid by New York residents.

Employment trends in New York City, the State and the Nation

While the expansion of employment in New York City since the recovery began seven years ago has been remarkable, the preliminary September employment figures show a loss of almost 20,000 jobs.  Although these estimates are subject to revision next month, declines of this magnitude on a monthly basis have been observed several times during the city’s employment recovery. The chart below shows the sharp and steady rise in employment in the city relative to both the state and the nation since the recovery of jobs began in 2010, and indicates the relative magnitude of the recent decline. In the city September’s losses were concentrated in the private sector and while steep, overall employment in the city in September is still up about 1.1 percent over September of last year. Comparisons of job growth with the nation this month are problematic, however, due to the hurricane-related distortions in the national payroll employment estimates.

Statewide, employment losses totaled about 34,000 though, like the city, overall employment in the state remained above its year-ago level by roughly 1.0 percent. The September declines in employment might have been hinted at in the August jobs report where the slowing pace of job growth nationally was also seen in both New York State and New York City. While the year-over-year growth rates held up, the month-over-month job growth rates in August were below the average monthly growth rates seen over the past year. In September, the decline in statewide employment was broad based across industries and, notably, declines occurred in the education and health sector which had been expanding throughout the downturn and recovery.

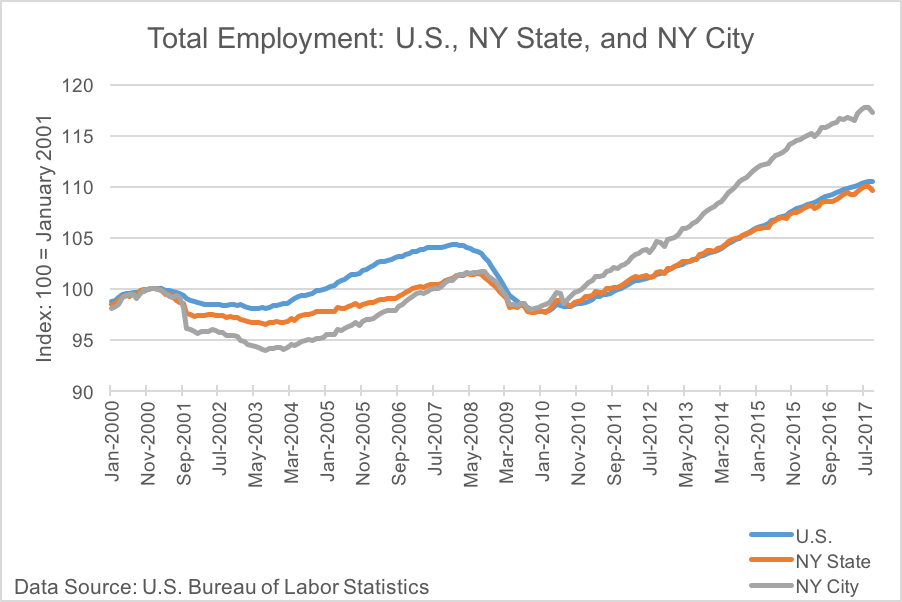
As discussed in a recent report, the areas outside of the city have not been showing the consistent strength in job growth that is seen in the city.  Moreover, as pointed out in an earlier post, the city’s strong job growth in this recovery has been accompanied by strong population growth and there was not the sharp decline in the city’s labor force participation rate during that period that was seen nationally. Data for upcoming months will show whether the job losses seen in September are continuing and thus providing more evidence of a possible cooling off in growth in both the state and city.

A look at the job growth rates by sector shows that over the past year, major services sectors—education and health services, professional and business services and leisure and hospitality—made strong contributions to the job growth rates in both the city and state. The relatively poorer performance of the finance and retail trade sectors is noteworthy. Employment in the finance sector has not been leading the recovery as in previous upturns and over the past year has seen only modest growth.

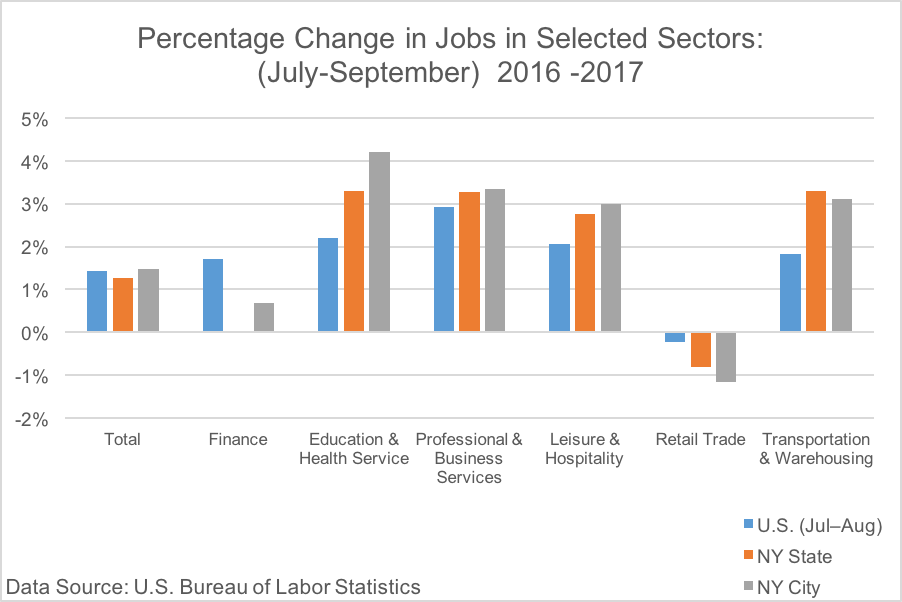
The decline in jobs in retail trade over the past year in the nationally and in New York State and New York City reflects, in part, the impact of the rise of online sales, or e-commerce, and the decline in sales in brick-and-mortar stores, particularly department stores, but also at stores selling electronics, sporting goods and clothing. A recent report shows that online shopping nationally now constitutes more than 10 percent of total retail sales. These shopping trends are increasingly supported by expanded personalized online marketing and rapid, often overnight, product delivery.

Department stores are especially affected by online shopping. Spending at department stores in August of this year was essentially flat from last year and down about 15 percent over the past five years. In the city and state, employment at department stores was down roughly 2 percent over last year and contributed to the decline in retail trade employment. Unlike the nation and the state, however, jobs in New York City in clothing, food and health and personal care stores increased. Finally, two recent reports suggest that the decline in jobs in brick-and-mortar retail stores are to some extent being offset by gains in the warehousing and transporting of goods. Jobs in this sector are up sharply in the nation, New York State and New York City, though these gains are not unambiguously related to the increase in online shopping.

Proposed elimination of state and local tax deductibility

The administration’s recently-released framework for federal tax reform proposes eliminating all itemized deductions for individuals other than for mortgage interest and charitable contributions. The proposed elimination of one such deduction, that for state and local tax payments, could have consequences for New Yorkers and the state’s economy. Under current law, individuals can take a deduction against their income for state and local taxes paid. These taxes consist of real estate taxes as well as either non-business income or sales taxes.

Estimating the amount of additional federal taxes that will be paid by New Yorkers as a result of eliminating the deduction is complicated because the framework proposes a number of other changes that will affect individual tax payments. These include changes to the value of the standard deduction and personal exemptions, the income limits applicable to the new tax brackets, and the elimination of the AMT, a parallel tax system for relatively high earners that does not allow these state and local tax deductions. A report from the Tax Policy Center estimates that the elimination of the state and local tax deduction alone would raise federal tax payments for individual New Yorkers who take the deduction by an average of $4000. An estimate by the New York City Comptroller’s office shows that the elimination of the tax deduction would not just affect higher income earners but affect taxpayers across a range of incomes. While there are some efforts to estimate the impact of eliminating the deduction on New Yorkers within the context of the proposed framework, the net changes in federal tax liabilities and, ultimately, the impact on economic activity will depend on what other aspects of the framework are adopted.

Is the New York Economy Slowing Down?2018-07-04T19:37:48+00:00

October 06: U.S. Lost 33,000 Jobs Amid Last Month’s Hurricanes

The unemployment rate declined to 4.2 percent in September, and total nonfarm payroll employment changed little (-33,000), the U.S. Bureau of Labor Statistics reported today. A sharp employment decline in food services and drinking places and below trend growth in some other industries likely reflected the impact of Hurricanes Irma and Harvey. Read more

October 06: U.S. Lost 33,000 Jobs Amid Last Month’s Hurricanes2017-10-06T18:37:40+00:00

Rising Interest Rates, Mortgage Interest Rates, and New York Home Prices

Richmond Kyei Fordjour
September 15, 2017

Conventional wisdom tells us that a rise in interest rates hurts the real estate sector since higher mortgage rates discourage first-time homebuyers and raises costs of existing mortgages. Surprisingly, the recent trends in mortgage rates and in housing market indices do not support this view. This article examines the facts in the New York Metropolitan area and the United States.

Interest rates—Government bond yields (10-year Treasury) and the 30-year Primary Mortgage Rate (the Freddie Mac Primary Mortgage Market Survey Rate)—have been rising since the end of the 3rd quarter of 2016, through the 1st quarter of 2017, and only briefly abated in the 2nd Quarter of 2017 (this year) and marginally came down (Figure 1).

Source: Federal Reserve H.15 and Freddie Mac.

The rise in interest rates, however, does not appear to have affected home prices in the United States in general, and the New York metropolitan area in particular (Figure 2). The Home Price Index for the New York-New Jersey Metropolitan Statistical Area has continued to rise in the same period:

Source: Federal Housing Finance Agency.

This observation may run contrary to logical expectation, since higher interest rates on mortgage loans means home buyers shall pay more in mortgage interest when they purchase their homes, and therefore the demand for housing may be reduced and dampen home price, and subsequently the Home Price Index. Putting this observation in a historical context, however, appears to provide some illumination. As Figure 3 illustrates, this is not the first time the NY-NJ Home Price Index has continued to rise in spite of rising mortgage lending rates. Positive correlations between them have been observed during other periods such as 2003 Q2-2006 Q3, 2013 Q1-2013 Q4.

Source: Federal Reserve H.15 and Freddie Mac; Federal Housing Finance Agency.

A closer inspection of the data reveals some clues as to why this pattern occurs. Consider the Mortgage – Treasury spread, calculated as the difference between the Primary 30-year Mortgage rate and the Treasury 10-year bond’s yield. The spread is a good proxy for measuring the relative cheapness of mortgage interest rates, because an investor considering making a fixed-income investment would compare yields on the government bond (the risk-free benchmark) versus that of the secondary mortgage market (the Mortgage Backed Security). Since Mortgage Backed Securities typically have average durations of less than 30 years and considering the relative flatness between the 10 and 30-year points on the Treasury yield curve, these two assets have broadly equivalent maturity. Examining the trend in the spread and the change in the home price index, which is also called home price appreciation rate, yields an interesting insight into the correlation between the two series (Figure 4). A simultaneous increase in both series indicates that a relative decline in the mortgage rates is accompanied by home price appreciation, consistent with the conventional wisdom.

The data indeed indicates that except for one subperiod, overall the home price appreciation rate moves together with the spread. During 1999 Q1-2000 Q1 the high spread indicating relatively expensive borrowing rates are likely to have come about as a consequence of high sustained demand, as home prices had also been rising rapidly in that same period. After 2003 the spread abated then reverted and stabilized until the beginning of the financial crisis. During this period, the increase in the relative cost of mortgages is also accompanied by a steep devaluation of the Home Price Index when the real estate market slumped in the New York metropolitan area.

After the brief spike in the spread in 2008 when the Fed was embarking on aggressive monetary easing in the wake of the financial crisis, the spread converged with the home price appreciation rate—from 2010 onwards—and the two have been trending together, an indication that demand for homes and mortgage interest costs were roughly in balance.

Source: Federal Reserve H.15 and Freddie Mac; Federal Housing Finance Agency and author’s calculations.

Comparing these historical occurrences by looking at the movements of spread and that of the home price appreciation rate, rather than considering only the movements in the levels of mortgage rates and the Home Price Index, we have been able to gain better insight into the dynamics underlying these observations. Accordingly, the Home Price Index has been broadly rising in the face of a rising level of the spread or a demand-driven increasing relative cost of mortgages.

Rising Interest Rates, Mortgage Interest Rates, and New York Home Prices2018-07-04T19:37:49+00:00

Technical Note: Federal Funds Rate Hike and Sovereign Risk in Latin America

Model

We conduct a country-by-country time series analysis of the government reaction function using impulse response of the country risk (Measured by the EMBIG) to an increase in de Federal Funds Rate. For this purpose, we part from a simple reaction function that we estimate for each country:

(1) st = α + Bit-1 + et where et ~ i.i.d.

Where s and i are, respectively, the country risk and the U.S. Federal Funds Rate. The latter is exogenously defined by the Federal Reserve.

Data and Methodology

The country risk variable is proxies with the EMBIG index, as explained in the main article. For this variable, the source of the data is the World Bank Economic Monitor. For the Federal Funds Rate, the source is FRED. We first test the stationarity of each variable. Tests reject non stationarity of all the first differenced series at the 95% confidence level.

The VAR lag order selection criteria indicates that 1 lag is optimal. Since for small samples, the AIC is more appropriate, we report its results for each country for different lags (Table 1). Both the Trace and maximum Eigenvalue tests in Johansen Full information Maximum Likelihood test suggests one cointegrating equation for different model assumptions concerning deterministic trends. We select the one with intercept and no trend in VAR.

Next, we proceed to build a Vector Error Correction Model (VECM), country by country, with one lag determined optimally as described above:

(3) Δyt = -Πyt-1 + ∑i=1 ΦjΔyt-i + ui,

Where yt =

[st, tt-1]’, Π = (I-∑i=1Ai) and Φi = -∑i=1Aj = -A(L).

Results

In Table 2 we report the long-run cointegration equations for each country.  For all of them, an increase in the Federal Funds rate generates an increase in the EMBIG. How do these results hold in the short run? To answer this we turn into impulse response functions, which are displayed in the second graph of the main article. The short-run results are consistent with the long-run ones: an increase in the Federal Funds Rate generate, on average, during the following next quarters, an increase in the country risk.

Table 1. AIC for each country 1 to 3 lags.

Country AIC 1 lags AIC 2 lags AIC 3 lags
Argentina 19.83 20.15 20.10
Brazil 17.35 17.50 17.48
Colombia 13.73 14.74 15.82
Mexico 14.31 14.62 15.50


Table 2. Vector Error Correction Models.

 Cointegrating Eq:   CointEq1
 FEDRATE(-1)   1.000000
 EMBIG_ARG(-1)  -0.002028
    (0.00082)
   [-2.46806]
 C   0.381888
Cointegrating Eq:  CointEq1
EMBIG_BRA(-1) 1.000000
FEDRATE(-1) -143.4935
  (39.1876)
  [-3.66171]
C -144.2223
Cointegrating Eq:  CointEq1
EMBIG_COL(-1) 1.000000
FEDRATE(-1) -102.1662
  (20.8519)
  [-4.89961]
C -88.09853
Cointegrating Eq:  CointEq1
FEDRATE(-1)  1.000000
EMBIG_MEX(-1) -0.037714
   (0.00541)
  [-6.97417]
C  6.930402

Note: The table displays the estimation results of the cointegrations equation for, respectively, Argentina, Brazil, Colombia and Mexico. 

Technical Note: Federal Funds Rate Hike and Sovereign Risk in Latin America2018-07-04T19:37:49+00:00

September 01: Total Employment Increased by 156,000 in August, and the Unemployment Rate Was Little Changed at 4.4 Percent

Total nonfarm payroll employment increased by 156,000 in August, and the unemployment rate was little changed at 4.4 percent, the U.S. Bureau of Labor Statistics reported today. Job gains occurred in manufacturing, construction, professional and technical services, health care, and mining. Read more

September 01: Total Employment Increased by 156,000 in August, and the Unemployment Rate Was Little Changed at 4.4 Percent2017-09-01T16:25:26+00:00

Federal Funds Rate Hike and Sovereign Risk in Latin America

Miguel Acosta-Henao
August 31, 2017

The Fed has started increasing the federal funds rate, reversing its decade long accommodative monetary policy.  The last time such a reversal in the Fed policy occurred, the impact on emerging markets in Latin America was deleterious. This article examines if history will repeat itself. 

By the end of the 1970s the most important Latin American economies had opened their capital accounts to the rest of the world and received a considerable amount of capital inflows that were financing sovereign debt.  However, this ended when the Federal Reserve (FED), led by Paul Volcker, pursued a sharp disinflation, increasing the federal funds rate, and resulting in high capital outflows from emerging markets to the U.S. These flows caused long currency depreciations and increased the risk premium of sovereign bonds in those countries. As a result, as documented by Krugman (2009), Mexico, Argentina and Brazil went into technical default, capital inflows ceased,  inflation sky rocketed (especially in Argentina) and these economies, as well as the rest of the region, entered into deep recessions that took a severe toll on Latin America’s potential growth through the 1980s.   

Currently, ten years after the start of the great recession, inflation is converging to the FED’s 2% target and the labor market in the U.S. continues giving signals of strength–an unemployment rate of 4.3% and a payroll job growth matching the growth before the start of the crisis in 2007. These facts have led the FED to increase the federal fund’s rate and to announce more hikes during this year.

Latin American countries are not as indebted as they were at the beginning of the 1980s (except for Venezuela) nor do they have the same weak macroeconomic institutions they had in the past. Economic fragilities, however, exist.  Between 2003 and 2013 Latin America received a considerable amount of foreign investment. Unlike the 1970s, however, it was in the form of gross capital formation directed to the commodities sector (mainly oil). This meant that governmental borrowing was not as significant as it was thirty years ago. Nevertheless, a reversal of capital flows would still affect the whole external debt of the region, whether is public or private, due to currency depreciation and a negative effect on each economy’s sovereign risk, which could lead these countries to the brink of a recession. One part of this process has already started following the commodity price shocks, with average currency depreciations of 30% between 2014 and 2017 for Mexico, Brazil, Colombia, Chile, and Peru.

Sovereign Risk in Latin America

The benchmark estimate of country interest rate spreads for emerging markets is J.P Morgan’s Emerging Market Bond Index Global, EMBIG.  The Index, which compares a composite of bonds with different maturities and liquidities in each country with a similar composite for the U.S, reflects sovereign risk in those countries, is available starting in 1994 for selected Latin American countries. Figure 1 shows both the evolution of the EMBIG from 1994 for the most representative emerging countries in Latin America (excluding Venezuela), and of the federal funds rate during the same period.

Figure 1: EMBIG Selected Latin American economies (basis points).

Between 1998 and 2001, most Latin American economies suffered deep recessions that started with the increase in their sovereign risks, as it can be seen in the graph. But, in line with the massive capital inflows that the region received between 2003 and 2013, the EMBIG of each country substantially decreased during those years.  It has risen modestly recently, although not at all close to the levels seen before the year 2002.

Impact of the FED Funds Rate on Sovereign Risk in Latin America

For each country, we estimate an econometric model that allows us to see the response of each country’s sovereign risk to the FED’s rate hike. For each country in the sample, Figure 2 shows the response of sovereign risk to a 100 basis point increase in the federal funds rate.

Figure 2: EMBIG response to a to 100 points increase in the federal funds rate (basis points).

Figure 2 presents the results of our estimation, which show a large and sustained response of interest rates in each of the countries to a rise in the U.S. federal funds rate.  These results are in line with those of Uribe and Yue (2006), who show that for a group of emerging markets, an increase in federal funds rate leads country spreads to fall and then display a large, delayed overshooting.  Clearly, the results are alarming: an interest rate hike in the U.S. has a permanent negative effect over the country risk for Latin America, let alone a continuous path of interest rate hikes like the one the FED plans to do.

Will history repeat itself?

Contrary to the episode in the 1980s, most Latin American countries have central banks with full independence and explicit inflation targets. External debt as a share of GDP is, on average, less than 70% compared to the 3-digit numbers in the 1980s. Some countries like Colombia have explicit fiscal rules that contribute to smooth the cycle through fiscal policy while committing to keep the public deficit within a defined range. However, it doesn’t mean that the region is completely shielded against the FED’s hike. The increase in country risk compromises investment in countries that still lack physical infrastructure to compete with other emerging countries such as China or a number in South East Asia; the volatility that this brings to the business cycle contributes an increase in uncertainty about the future and may generate misallocation of capital among investors, and pressures over governments to raise taxes and reduce government spending (in order to avoid a down grade in their risk rating) may imply fiscal reforms that seriously slows down (or even contract) the growth rate of the GDP in those countries.

It is then important that not only governments but also central banks among those countries prepare themselves correctly for what may come. Recent literature has pointed out the importance of capital controls in booms and busts as a potential tool to help reduce the volatility of the business cycle. Also, imminent tax reforms like the one Colombia had during 2016 (which aimed to increased tax revenue) could be complemented with institutional reforms that contribute to improving productivity, which has been Latin America’s longer-term problem as shown by Restuccia (2013). All in all, the main point is that, even though the region seems more prepared than before to a FED’s hike, it is still vulnerable according to our empirical analysis; therefore, the region should consider new policy tools as well as important structural reforms to reduce the exposure that it has to foreign interest rate shocks.


Federal Funds Rate Hike and Sovereign Risk in Latin America2018-07-04T19:37:49+00:00

August 30: Revised Q2 GDP Growth Came in Higher Than Expected at 3%

Real gross domestic product increased 3.0 percent in the second quarter of 2017, according to the “second” estimate released by the Bureau of Economic Analysis. The growth rate was 0.4 percentage point more than the “advance” estimate released in July. In the first quarter, real GDP increased 1.2 percent. Read more

August 30: Revised Q2 GDP Growth Came in Higher Than Expected at 3%2018-07-04T19:37:49+00:00
Go to Top