
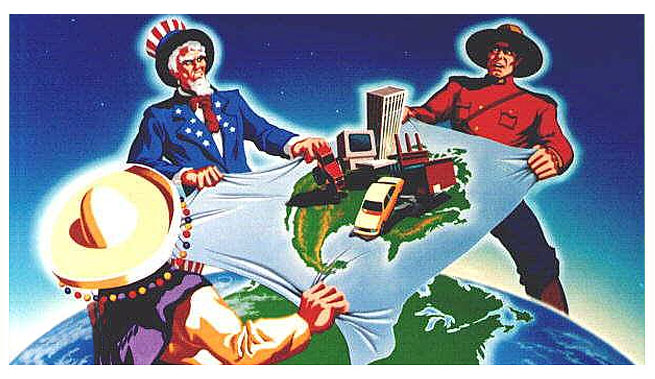
A Primer on Rules of Origin in NAFTA Negotiations and What Is Next
Richard J Nugent III
December 22, 2017
The latest round of negotiations of the North American Free Trade Agreement (NAFTA) on November 21 ended with no major breakthroughs on contentious issues such as autos, dairy and rules of origin among others. The US administration’s demand that at least half of a NAFTA-qualifying vehicle should be made in the US and 85 percent in North America met stiff resistance from Canada and Mexico. Compromise on rules of origin for the North American automotive industry will matter for the successful renegotiation of NAFTA.
What is rules of origin (ROO) and why do we need it?
NAFTA ROO can be loosely defined as a set of rules that are used to determine whether a good can be considered as being made in North America. If this is the case, then these goods are typically exempt from tariff when traded between two North American countries. Article 401 of the Agreement defines “originating” in four ways: (i) goods wholly obtained in the NAFTA region; (ii) goods meeting the Annex 401 origin rule on specific ROO; (iii) goods produced entirely in the NAFTA region from originating materials; (iv) disassembled goods and goods described with their parts that do not meet the Annex 401 specific ROO but contain 60 percent NAFTA content in transaction value. Article 403.5.a increases the value-content requirement for motor vehicles to 62.5 percent. The Trump administration has proposed increasing this requirement to 85% and adding a 50% U.S.-specific value-content requirement for motor vehicles. This would require a larger portion of the motor vehicle production process to be sourced within the region and in the United States, particularly.
The use of ROO are in principle to deter trade deflection. The objective is to prevent resources from being sourced from a country outside a free-trade region for assembly inside the region and later exported at preferential tariff rates within the free-trade region. If for example a can opener is assembled in Mexico from parts that are made in Brazil, the origin of this can opener is Brazil. Were this can opener exported to Canada or the United States, it would be subject to MFN tariffs as opposed to NAFTA preferential tariff rates.
NAFTA eliminates tariffs on most goods originating in Canada, Mexico, and the United States. The ROO for goods that are not wholly obtained from the NAFTA region are based on a tariff-shift method, regional value-content method, or technical process test:
- Under the tariff-shift method, a product earns preferential treatment under NAFTA if it has a different Harmonized Tariff System classification than its imported inputs for a particular statistical level. This means a product can earn NAFTA-origin status if it has been modified substantially within a NAFTA country.
- The value-content method requires a good traded within the region to contain at least 50 to 60 percent NAFTA content to obtain origin status.
- Technical process tests can require incorporation of specific parts or require a particular method of assembly. Technical process tests are found in machinery and equipment manufacturing and the apparel and textiles industry. A common technical process test used in the apparel and textile industry is “yarn-forward.” Yarn-forward requires the yarn that is used to make fabric be spun in the NAFTA region. Thus, cotton that is imported from Pakistan to Mexico, spun into cotton yarn, and later used to make slacks can be exported to the United States at preferential NAFTA rates. “Yarn-forward” observes Mexico as these pants’ origin. However, if the cotton is spun into yarn in Pakistan and then imported into Mexico where it is used to make the slacks, the origin of the slacks is now Pakistan.
How do the ROO work?
We can answer this question by reviewing examples of tariff classification and origin rulings issued by the U.S. Department for Customs and Border Patrol. In 2004, a U.S. producer sought to import wiper blade arms from Mexico, which were made with a “non- originating” flat-coated wire. This piece might have disqualified the wiper blade arm from NAFTA preferential treatment. However, the Mexican supplier substantially modified the wire: it was imported into Mexico under Chapter 72 and exported to the United States under subheading 8512.90 as a part of the wiper blade arm, which is qualified for preferential treatment under NAFTA. In 2010, a Canadian producer sought to export vehicle door locks. The door locks were assembled in Canada using components made exclusively in China and Germany. No component of the door lock originated in Canada. As such, the locks did not qualify for preferential treatment under NAFTA, and the rate of duty assigned to the locks was 5.7 percent.
How do ROO impact trade?
ROO exist to protect the interests of the countries participating in a multilateral free trade agreement, but could potentially distort trade flows. Distortions are particularly pervasive where global supply chains are big players in shaping the way trade occurs between two countries. The role of supply chains increases with the prevalence of global value chains in international trade. Studies have demonstrated that the expansion of these value chains means that production has become increasingly fragmented and supply chains are being vertically integrated across countries. Many firms in different countries are taking part in particular stages of the production process, together forming a global supply chain. This form of fragmented production results in intermediate inputs crossing international borders several times before final delivery. ROO therefore have rigid and costly implications for the way goods are produced and traded in global markets. Where global supply chains exist partially outside of a free trade agreement, a change in ROO could be potentially deleterious. When goods cross multiple borders or cross borders multiple times as in the fragmented production processes, they are exposed to more trade costs which can accumulate and compound before the goods are sold for final consumption. Thus, production which is labeled non-originating by a change in ROO can be very costly.
A study on how the characteristics of U.S. industries helped to shape NAFTA ROO finds that industries characterized by larger returns to scale sought tougher ROO, while industries dependent on global supply chains sought more permissive ROO. Firms that face ROO decide whether to comply with the rules so as to export at preferential tariff rates, or to not comply with the rules and source inputs unconditionally. Researchers who study this decision by Mexican firms find that the ROO for final goods led to a 115 percentage point reduction in imports of intermediaries from non-NAFTA countries after the implementation of NAFTA.
ROO are a useful component of free trade agreements in their role to prevent trade deflection. However, the rules can be exploited in the objective of industry protection and can potentially distort trade flows. Additionally, if ROO are changed in a way that disrupts global supply chains, the costs of delivering some goods could mount considerably. Furthermore, if the parties renegotiating NAFTA stand firm regarding the motor vehicles regional content requirement, the future of NAFTA could be in a precarious place.
