April 12: IMF Projects a Slowdown in Economic Growth in 2019
The economic outlook in industrial economies and major emerging markets is deteriorating. The IMF cut its economic forecasts for growth in 2019 to 3.3% from 3.7% in October. Read more


The economic outlook in industrial economies and major emerging markets is deteriorating. The IMF cut its economic forecasts for growth in 2019 to 3.3% from 3.7% in October. Read more
Two years after the death of Sir Anthony Barnes “Tony” Atkinson, characterized as the father of modern inequality research by Paul Krugman, the question of measuring inequality remains more crucial than ever.
The need for improved economic indicators was echoed recently in a David Leonhardt article about the U.S. economic recovery 10 years after the collapse of Lehman Brothers. He claimed that, while accurate, our most prominent economic measures of the recovery, such as the Gross Domestic Product (G.D.P.), the unemployment rate and the Dow Jones Industrial Average are problematic in that due to the inequality in the distribution of income they mislead the public conversation about people’s lives and economy. Leonhardt does not discuss the need for new and improved indices of inequality. When he describes the increase in inequality, instead of reporting the rising Gini coefficient, the most commonly used measure, he points to a gloomier reality by using graphs, such as the one below, that show the large and growing share of economic income that has been going to an elite class of “very rich” people.
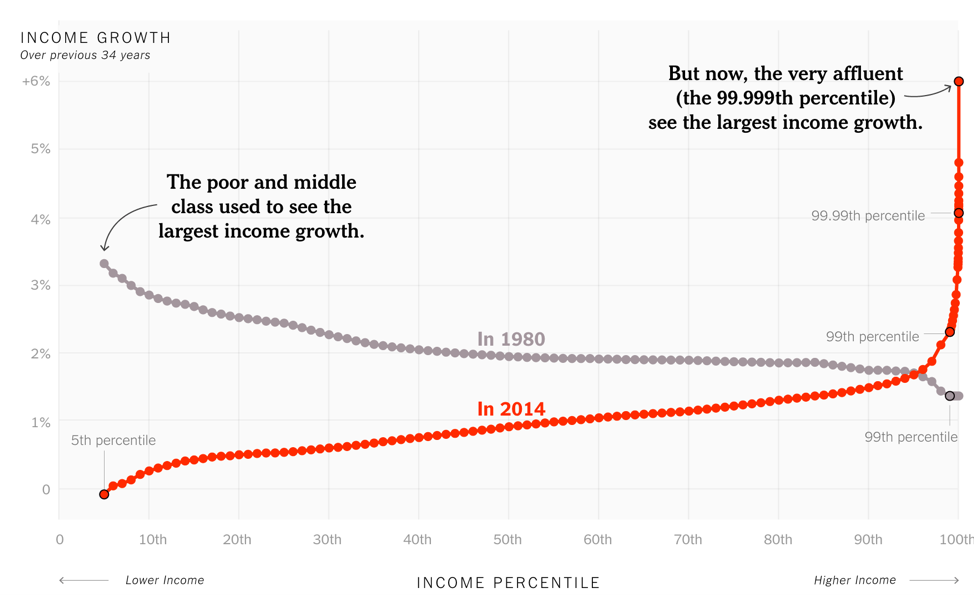
Source: New York Times
So, does the Gini coefficient fail to describe the increase in inequality? Definitely not, but maybe it’s time for new measures that “do a better job of capturing the reality” of growing well-being inequality, especially, after the global financial crisis.
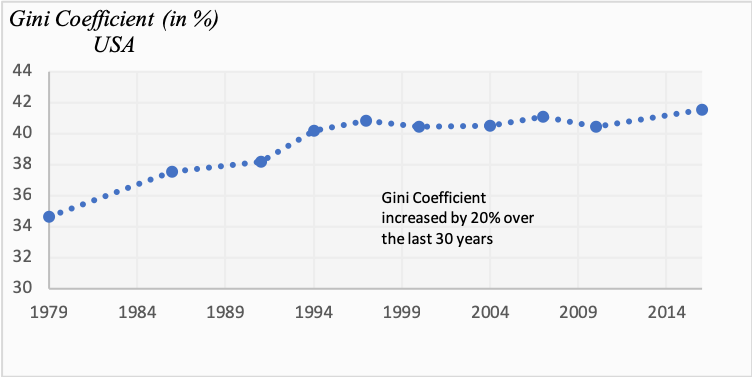
Source: World Bank
These new measurements would also inform the public conversation about economic reality and about how policies could improve peoples’ lives. They could also give insight into the rise of populism in the political life of the Western World and especially across Europe. For example, Britain currently realizes that there may be no good terms for Brexit while Labor leader Jeremy Corbyn blames Prime Minister Teresa May for the rising poverty and inequality amid the Brexit chaos. A recently published study shows that individuals from the bottom of well-being distribution in Britain were more willing to vote for Brexit. Will the Britains who voted for leaving the union find themselves worse off in a near future well-being distribution? This question will not be easily answered. Another question is whether and how Brexit will affect inequality in Britain, especially given the fact that the U.K. Gini coefficient has actually been decreasing modestly over the past 15 years.
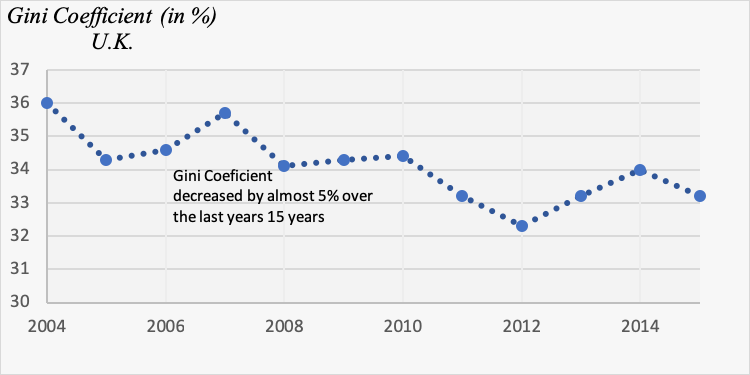
Source: World Bank
In the early 1970s, the British economist Tony Atkinson proposed an alternative index that helps to make comparisons of income inequality among countries or across different time periods when the Gini coefficient is inconclusive. His idea could be easily described in a risk-taking framework, despite the fact that Atkinson has presented it in a different way. Suppose that it is equally likely for someone to be born in any of the almost 127 million U.S. households. Hence, a child could be born to a wealthy family on the Upper East Side of New York City or to a family in Centreville, Illinois, where 35% of the population is below the poverty line. Indeed, that would be really risky and probably the unborn child would be unhappy facing its first lottery. Atkinson suggested the new measure of inequality using a hypothetical country where all the households have the same income. What would be the minimum income at which the soul would be willing to call off the risky lottery and choose to be born in this hypothetical land without inequality? Probably the minimum accepted equally distributed income would be much lower than $90,000, almost the level of the U.S. mean household income today.
Atkinson’s index shows the share of the mean household income that should be omitted in order to find the minimum accepted income. As the graph indicates, people in the USA and the UK are increasingly willing to accept a smaller and smaller proportion of the current mean household income in order to avoid the observed degree of inequality.
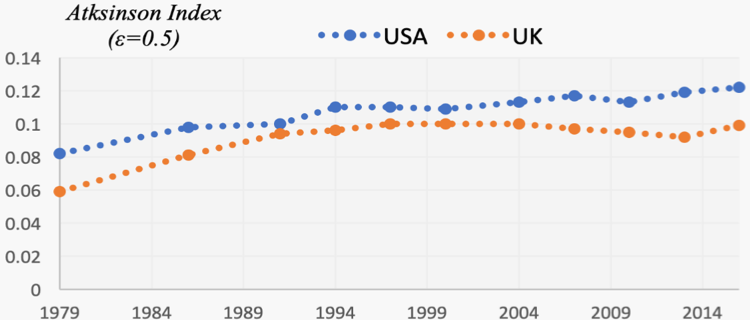
Source: LIS Data Center
In a very interesting paper which accommodates the analysis of globalization’s effects on income distribution, Branko Milanovic and Christoph Lakner study global inequality by using data from almost 600 household surveys from approximately 120 countries. Although between 1988 and 2008, the global Gini and Atkinson index fell by 2.3% and 5.7% respectively, their levels are still very high (Gini: 70.5% and Atkinson (0.5): 41%).
Both the Atkinson index and the Gini coefficient measure income inequality while ignoring other dimensions of well-being, such as health status or education and social reality such as the level of equal opportunities. Maybe the societies in the Western world would not be reluctant to accept a high degree of income inequality if the upward social mobility for hard-working people was not as difficult as observed in recent studies by Miles Corak. His graph below uses a measure of the link between the earnings of fathers and sons to measure social mobility. The relatively high measures for the United States and the United Kingdom indicates that social mobility is more problematic than in Australia, Canada, and Scandinavian countries.
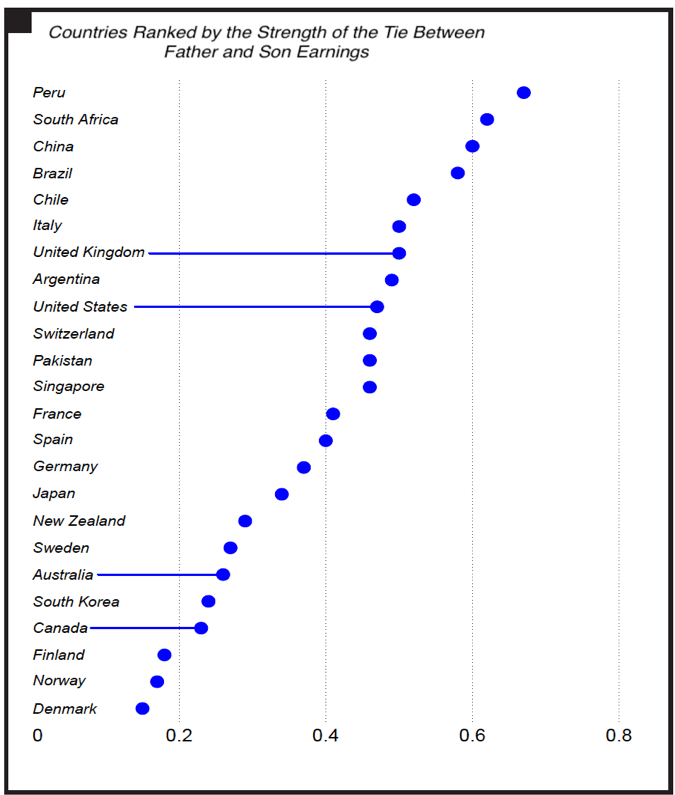
Source: M. Corak, 2016
Note: The horizontal distance displays the intergenerational earnings elasticity between fathers and sons (i.e., the percentage difference between the adult earnings of a son for a one-percentage-point difference in the father’s earnings. The higher the value, the tighter the link between parent and child earnings, and the lower the degree of intergenerational mobility.
Atkinson was one of the first who realized that inequality should be measured beyond G.D.P., and his papers in the early 1980s, along with other scholars, are considered as the beginning of multidimensional inequality literature. Quite remarkably, the literature was in its infancy for more than two decades but in recent years there has been a rising interest from academics and policy-makers (e.g., Stiglitz, et. al.) Hopefully, in the future, this growing literature on multidimensional measures of poverty and inequality will provide policy-makers with better tools to address these critical problems.
The U.S. market’s most reliable recession indicator flashed red on Friday, when the Treasury yield curve inverted for the first time since 2007. Is the next economic downturn here? Read more
The U.S. international trade deficit increased in 2018, according to the U.S. Bureau of Economic Analysis and the U.S. Census Bureau. The deficit increased from $552.3 billion in 2017 to $621.0 billion in 2018, as imports increased more than exports. Read more
Part II
With the collapse of Lehman Brothers in September 2008 and the transmission of the crisis to world financial markets, financial liquidity started to drain and investors’ confidence began to deteriorate. Central banks around the globe initiated unprecedented expansions of their liquidity facilities aimed at preventing the collapse of their banking systems and their economies.
The Greek banking system found itself at the epicenter of a great sovereign debt crisis, trapped in a vicious cycle, exacerbated by a deep and prolonged recession that lasted nearly eight years. The sharp disruption in financial intermediation and the threat to bank solvency forced the authorities to bail out the more important banks. Throughout the crisis, the financial authorities responded numerous times to the liquidity strain by injecting Euro-system funds (figure 1, panel a). From August 2011, the European Central Bank authorized a special credit line to the Greek banking system, called the Emergency Liquidity Assistance, upon which the banks depended heavily, especially during periods of deposit withdrawals. In June 2012, after the restructuring of sovereign debt, European Central Bank funding amounted to around 136 billion euro and came almost exclusively in the form of Emergency Liquidity Assistance. The final resort to this expensive source of funds took place in May 2015, as deposits again dropped substantially when negotiations between the newly elected government and its creditors had stalled (figure 1, panel b). Alongside the provision of liquidity, the authorities initiated three rounds of successive capitalizations for the banking system, with large capital injections equal to about 43 billion euros.
Figure 1. Banks’ borrowing needs and Domestic deposits
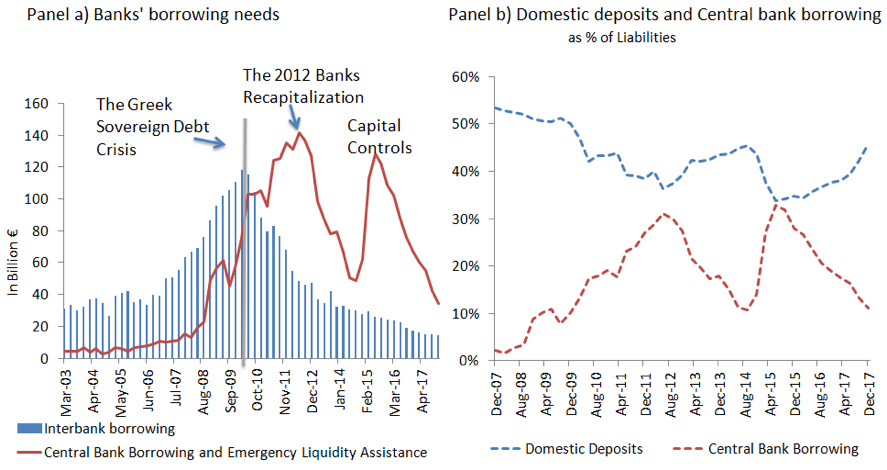
Source: Bank of Greece
Attempts at reviving credit growth in the Greek Economy
The tightened lending conditions had severe consequences for the majority of credit-dependent, small-to-medium enterprises, and thus for the Greek economy as a whole. The critical significance of small-to-medium enterprises is documented in the survey regularly conducted by the ECB, which reveals that they contribute roughly 70.2% of the total value-added while accounting for 70.6% of banks’ lending. By contrast, the percentages for the small-to-medium enterprises in the euro-area are 49.9% and 58.1%, respectively. The credit asphyxia became apparent in late 2010 when banks stopped providing loans to corporations and households. According to the following graph, the credit contraction began in November 2008, as the global financial crisis spread to the European Union. Prior to 2008, and with Greece’s entry to euro-area, banks were provided with access to low-cost credit and to ample liquidity. The banks embraced retail and corporate lending, which entailed excessive leverage. Mortgage loans rose by an average of 30% year-on-year, topping all other euro-area countries, while consumer loans increased by 28% over the same time period.
Figure 2. Corporate lending activity ( year over year %)
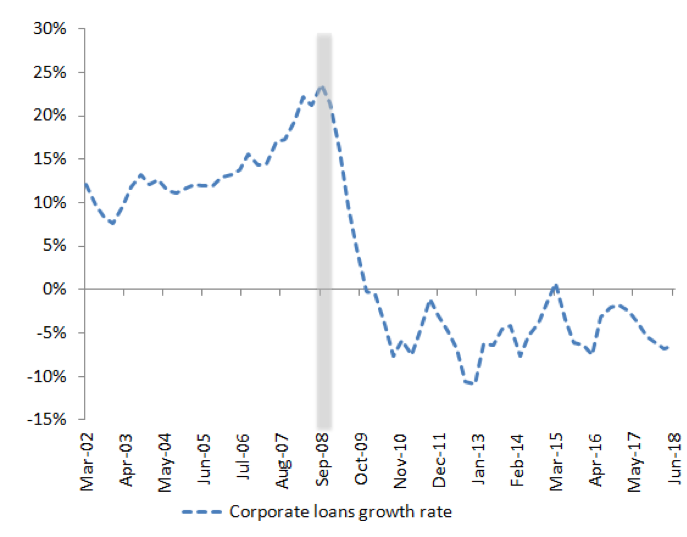
Source: Bank of Greece
Despite all above efforts and with an improved Banks Capital Adequacy Ratio to 18%, compared to an average of 16.7% for the main banks in the euro-area, Greek banks remained still unable to finance the economy. Loans to households are receding while credit to corporations is stagnating (figure 2). The failing attempts of reviving credit growth is attributed to the large stock of non-performing loans (NPLs) held by banks on their balance sheet. A high NPL ratio, or the percentage of the value of total loans that are non-performing as a share of total loans, requires banks to put more capital aside thus reducing credit availability. In addition, banks with a high NPL stock become more risk-averse and cautious in their lending and tend to focus mainly on improving asset quality.
The Non-Performing Loans Issue
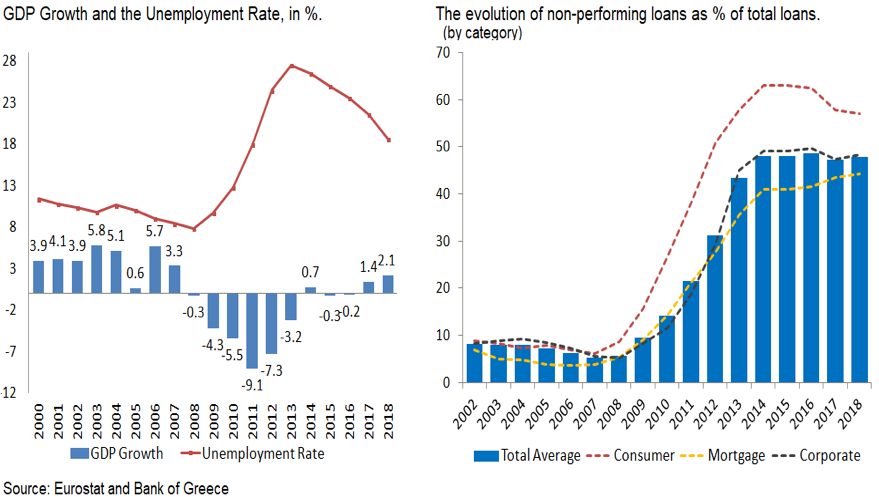
The NPLs ratio rose from 4.6% in 2007 to 9.1% in 2010 and to 31.9% in 2013 before surging to 47.5% in 2016 (figure 3, panel a). As of the second quarter of 2018, NPLs NPL stood at 45.5% of total loans, the largest percentage by far within the Euro-area (figure 3, panel b). It is now common knowledge that the accumulation of NPLs on their balance sheets explains why the banks have been unable to support any resumption of credit expansion and thus economic growth.
Figure 3. Non-performing loans as % of total gross loans
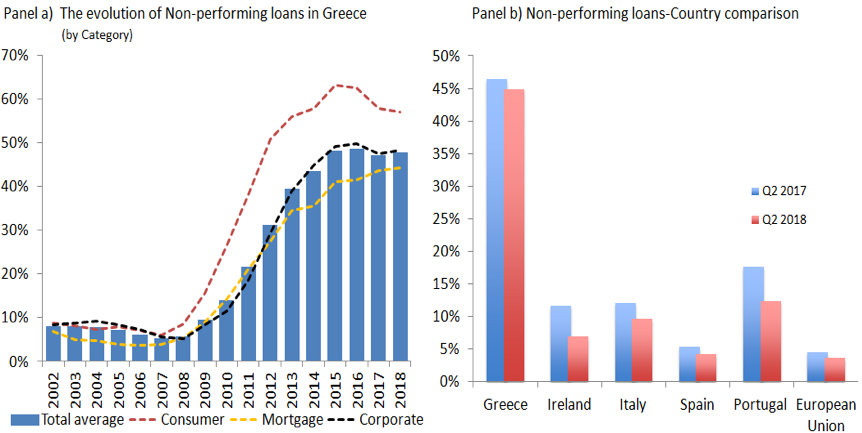
Source: Bank of Greece and European Central Bank
The severity of the depression had led to the NPLs rise to this extraordinary level. Contributing to this increase were problematic corporate governance practices with poor management and inadequate assessment of credit risks. Loans granted in the pre-crisis period to political parties and to corporations with low creditworthiness but privileged relationships with banks are a notable example. Reform of corporate governance practice was, in fact, raised as a precondition for the 2015 capitalization. Based on the “fit and proper” criterion, most board members of the banks were evaluated and some replaced to ensure the safety and soundness of the banks on boards they served.
Also, an important dimension of the NPLs problem lies in the existence of a significant percentage of borrowers who have the capacity of servicing their loans but have decided not to do so, hoping for a future major hair-cut of their loans. The so-called strategic or willful defaulters, differed from the distressed defaulters are taking advantage of debtor protection program and of the absence of any consequences. They comprise around one-fourth of the total NPLs.
Conclusion and Lessons Learned from the Sovereign Crisis
The sovereign debt crisis revealed a strong negative feedback loop between the government and the domestic banking system. Banks supported Greek sovereign bond prices by accumulating Greek government bonds during the crisis, while the government provided guarantees and bailout funds. The resultant fiscal costs and lack of lending opportunities to corporations, which increased sovereign distress even further, should raise serious concerns regarding this relationship.
The sovereign debt crisis placed the banking sector in a very vulnerable position, threatened by insolvency and poor loan performance. High credit growth along with the excessive risk-taking for loans granted to entities with minimal creditworthiness and the great reliance on accumulated domestic sovereign bonds remain key issues. After the recent experience, the European Central Bank has put a ceiling in domestic government bonds accumulation.
In conclusion, the Greek economy needs higher and sustained growth. Restoring full confidence in the financial system and reviving bank lending, especially to corporations, is paramount. But the large percentage of NPLs stands in the way, limiting the ability of the banks to support economic growth. They need to clear the bad loans off their balance sheets. Otherwise, as the International Monetary Fund has recently announced, banks will continue to need fresh capital injections in a vicious cycle seemingly without end.
U.S. GDP increased at an annual rate of 2.6 percent in the fourth quarter of 2018, according to the “initial” estimate released by the Bureau of Economic Analysis. In the third quarter, real GDP increased 3.4 percent. Read more
Part I
The Greek economy appears finally to have turned the corner with the Government’s announcement, in August 2018, that the country has exited its third bailout package. This article examines the role of banks in the recovery and the debt crisis.
Economic activity has registered positive growth for two consecutive years and seems to be on track to maintain that growth, albeit at just under 2%, for the next two years. As the government proceeds without a new line of credit from its creditors, Greek banks seem incapable of contributing to any further economic expansion. They remain vulnerable, still burdened by the gigantic number of the non-performing loans (NPLs) and therefore poorly positioned to finance new investment. The NPL ratio, now close to 45% of total loans, greatly undermines the banks’ ability to lend to the private sector.
In this context, we attempt to answer the question: why did the Greek banks get into such trouble? A series of two parts, which are closely related helps to explain how, the banking system evolved during the sovereign crisis. The first part deals with the impact of the crisis to the banking system, and the efforts made by the authorities to keep the banking system solvent. The second part deals with banks’ lending activities and the rise of the non-performing loans. We conclude with some lessons learned from the crisis.
The Acute Face of the Sovereign Crisis
The Greek banking system found itself at the epicenter of a great sovereign debt crisis and the attendant austerity program. It became trapped in a vicious cycle, which was exacerbated by a deep and prolonged recession that lasted nearly eight years. Unlike recent experiences in Ireland, and to a lesser extent Spain and Italy, the undercapitalization of the Greek banking system in 2012 was the result of the Greek sovereign debt crisis and, to a lesser extent, the unrestrained growth of lending following Greece’s entry into the euro-area.
The sovereign debt crisis emerged after the announcement by EU (European Union) authorities in 2010 that the Greek budget deficit for 2009 was 15.6% of GDP, four times higher than reported by the previous government, while measures of the public debt were revised sharply upwards to 126.7% of GDP. Once fiscal consolidation efforts took center stage, unprecedented public spending cuts and sizeable tax increases, along with the weakness of the euro-area economy, led to a reduction in output by about 28% through 2013 and a rise in the unemployment rate to a staggering 27.8%. As the country moved into the heart of the crisis, the deep recession and the austerity measures implemented by successive governments caused a number of corporations and households to default on their loans. As we discuss in part II of this series, the NPL ratio rose sharply and remains elevated.
 Source: Eurostat and Bank of Greece
Up until 2010, the Greek banking system was regarded as sound thanks to its limited exposure to “toxic financial instruments” and its strong capital base which, coupled with steady support from the Bank of Greece (BoG) and the ECB, ensured stability of the Greek banking system during the first two years of the world financial crisis.
Table 1. Risk-weighted Assets and Core Capital for Selected Banking Systems
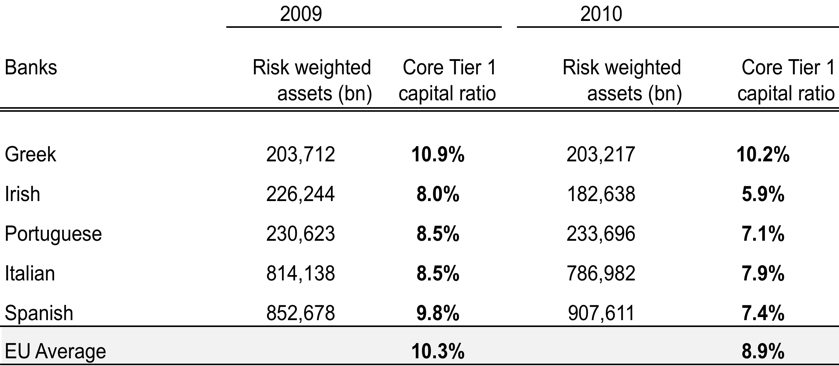 Source: European Banking Authority, stress tests as of 2010, participating banks
However, Greek banks were hit hard, as the uncertain value of sovereign debt and defaults spawned a series of downgrades of Greek debt and led to the first run on the banks. From December 2009 to end of 2011, households and corporations withdrew vast sums from the banks and deposits fell by more than 25%. The pressure on liquidity escalated further as successive downgrades of Greek bond ratings resulted in a higher cost of banks’ borrowing in wholesale and interbank markets.
The sovereign-bank nexus and the domestic bias
In early 2012, the banks brought to their knees, when the biggest sovereign-debt restructuring process in modern history took place. The orderly debt exchange of old bonds for new ones with longer maturities, known as Private Sector Involvement (PSI), entailed a 53.3% haircut on the nominal value of old bonds. In light of their large exposure to Greek government bonds , the banks took a huge loss of about 38 billion euros. They suffered bankruptcy with the depletion of their equity capital.
The PSI was especially costly to Greek banks as it followed on the heavy exposure to sovereign risk that developed as banks had added considerably to their holdings of government bonds, particularly between 2009-2011. Despite the evidence that substantial cross-border sovereign bond investment among member states of the Euro-zone facilitated financial integration, a “domestic bias” persisted strongly in some countries, especially in Greece. At the end of 2010, banks held in their investment portfolio a much greater portion of domestic sovereign debt compared to other countries facing similar circumstances. (Table 2).
Table 2. Sovereign Debt held by Banks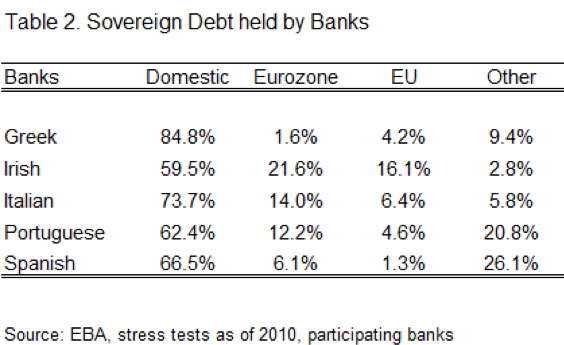 Source: European Banking Authority, stress tests as of 2010, participating banks
Large holding of domestic sovereign bonds, which are regarded as risk-free within the regulatory framework, provide the collateral needed to access liquidity from interbank markets and the Central Bank. At the same time, excessive holdings of domestic sovereign debt imply that, in times of crisis when sovereign risk increases – as in the case of Greece – access to wholesale funds and deposits (liquidity) can suddenly disappear. The composition of banks’ funding must then shift to an increasing reliance on Central Bank liquidity. Negative effects on the real economy follow from the transmission of credit-risk associated with sovereign debt to lending and investment activities in the private sector. An interesting question is why Greek banks at that time relied so heavily on domestic government bonds, knowing that every deterioration in sovereign creditworthiness reduces the market value of their domestic sovereign debt portfolio.
Bank Capitalizations and the Restructuring Phase
The sharp disruption in financial intermediation and the threat to bank solvency forced the authorities to bail out the more important banks. Stress tests concluded that necessary re-capitalization amounted to 28.6 billion euros. A newly created Hellenic Financial Stability Fund financed 25 billion euros, about 90% of the total, while the rest came from the private sector. The share capital increase was completed in June 2013. A puzzling aspect of this episode concerns the fact that the authorities knew the banks had to be recapitalized because of the forced reduction in the nominal price of government bonds. Why, then, didn’t they leave the banks out of the PSI? Probably, the answer lies in the fact that the banks held a huge amount of the sovereign debt, and by excluding them, it would have compromised the outcomes of the debt-restructuring attempt.
In an effort to strengthen the financial system and restore public confidence, the financial authorities proceeded with an extensive restructuring and consolidation program for the Greek banking system, reducing capacity in the industry through mergers and takeovers and the liquidation of a number of commercial and cooperative banks. By 2014 the banking system recorded the largest decrease in the number of banks among the euro-area systems, and the new roadmap comprised only four major-systemic banks, commanding more than 94% of the total market share in terms of assets.
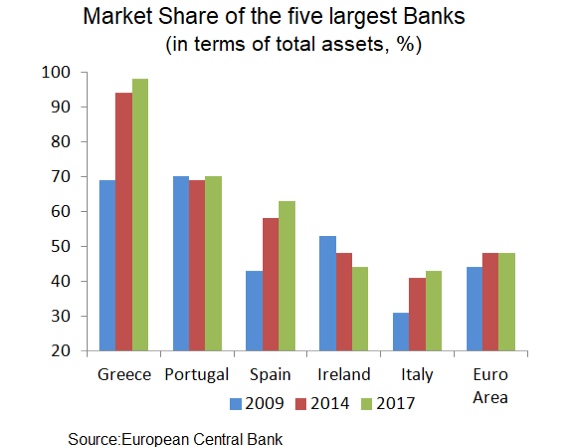 Source: European Central Bank
Another important recapitalization of domestic banks took place at the end of 2015. Following early elections in January 2015, the breakdown of the prolonged negotiations with creditors (from late 2014-June 2015) triggered a major bank-run, amounting to almost 42 billion euros. The Bank of Greece imposed a bank holiday in late June 2015, followed by capital controls. These dire events induced European authorities to orchestrate another recapitalization, equal to 14.4 billion euros. Roughly 10 billion euros was covered by the private sector and the remainder by the financial stability fund. This created a new shareholder landscape as the participation of the fund in previous recapitalizations was heavily diluted. Most of the shares were sold to private investors for a fraction of their nominal prices.
The recapitalization was finalized at the end of 2015, before the introduction of the EU Bank Recovery and Resolution Directive which called for a bail-in solution with a haircut on all unsecured deposits in excess of 100,000 euros. Since most of the large depositors had already withdrawn their funds from the banking system, the remaining deposits were mainly the working capital of small-to-medium enterprises. A haircut on their working capital would have further hurt the economy and put their existence at risk. But although the recapitalization improved the Banks Capital Adequacy Ratio to 18%, compared to an average of 16.7% for the main banks in the euro- area, Greek banks still remained unable to finance the economy. We explore the reasons for this in Part II of this series.
Do you remember the winter of debt?
In late 2010 and early 2011, the U.S. economy had barely begun to recover from the 2008 financial crisis. Around 9 percent of the labor force was still unemployed; long-term unemployment was especially severe, with more than 6 million Americans having been out of work for 6 months or more. You might have expected the continuing employment crisis to be the focus of most economic policy discussion.
But no: Washington was obsessed with debt. The Simpson-Bowles report was the talk of the town. Paul Ryan’s impassioned (and, of course, hypocritical) denunciations of federal debt won him media adulation and awards. And between the capital’s debt obsession, the Republican takeover of the House, and a hard right turn in state governments, America was about to embark on a period of cutbacks in government spending unprecedented in the face of high unemployment.
Some of us protested bitterly against this policy turn, arguing that a period of mass unemployment was no time for fiscal austerity. And we were mostly right. Why only “mostly”? Because it’s becoming increasingly doubtful whether there’s any right time for fiscal austerity. The obsession with debt is looking foolish even at full employment.
That’s the message I take from Olivier Blanchard’s presidential address to the American Economic Association. To be fair, Blanchard — one of the world’s leading macroeconomists, formerly the extremely influential chief economist of the I.M.F. — was cautious in his pronouncements, and certainly didn’t go all MMT and say that debt never matters. But his analysis nonetheless makes the Fix the Debt fixation look even worse than before.
Blanchard starts with the commonplace observation that interest rates on government debt are quite low, which in itself means that worries about debt are overblown. But he makes a more specific point: the average interest rate on debt is less than the economy’s growth rate (“r<g”). Moreover, this isn’t a temporary aberration: interest rates less than growth are actually the norm, broken only for a relatively short stretch in the 1980s.
Why does this matter? There are actually two separate but related implications of low interest rates. First, fears of a runaway spiral of rising debt are based on a myth. Second, raising private investment shouldn’t be a huge priority.
On the first point: Diatribes about debt often come with ominous warnings that debt may snowball over time. That is, high debt will mean high interest payments, which drive up deficits, leading to even more debt, which leads to even higher interest rates, and so on.
But what matters for government solvency isn’t the absolute level of debt but its level relative to the tax base, which in turn basically corresponds to the size of the economy. And the dollar value of G.D.P. normally grows over time, due to both growth and inflation. Other things equal, this gradually melts the snowball: even if debt is rising in dollar terms, it will shrink as a percentage of G.D.P. if deficits aren’t too large.
The classic example is what happened to U.S. debt from World War II. When and how did we pay it off? The answer is that we never did. Yet as Figure 1 shows, despite rising dollar debt, by 1970 growth and inflation had reduced the debt to an easily handled share of G.D.P.
Figure 1: Gross Federal Debt vs. Gross Federal Debt Held by the Public as Percent of GDP
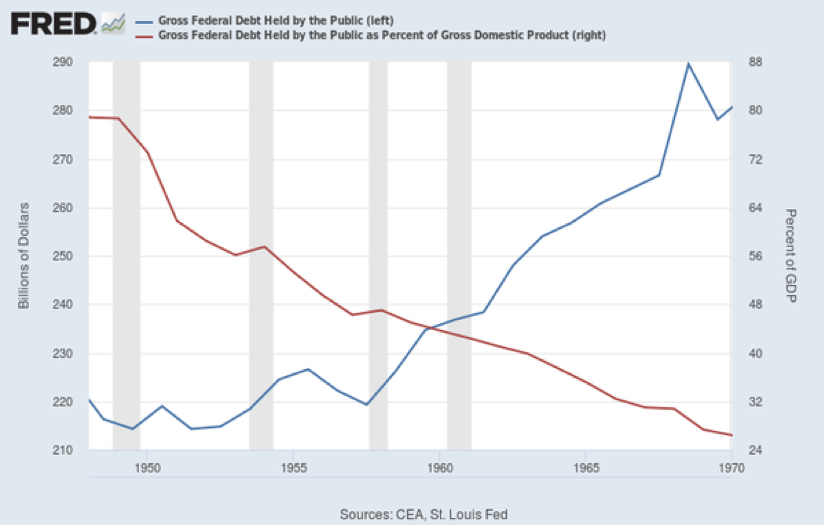
And if interest rates are less than G.D.P. growth, this effect means that debt tends to melt away of its own accord: a high debt level means higher interest payments, but it also means more melting, and the latter effect predominates. A self-reinforcing debt spiral just doesn’t happen.
Blanchard’s second point is subtler but still important. In general, debt scolds warn not just about threats to government solvency but about growth. The claim is that high public debt feeds current consumption at the expense of investment for the future. And high debt does indeed probably have that effect when the economy is near full employment (although in 2010-2011 more deficit spending would have led to more, not less, private investment).
But how important is it to suppress consumption to free up resources for investment? What Blanchard points out is that low interest rates are an indication that the private sector sees fairly low returns on investment, so that diverting more resources to private investment won’t make that much difference to growth. True, the rate of return on investment is surely higher than the interest rate on safe assets like U.S. Treasuries. But Blanchard makes the case that it’s not as much higher as many seem to think.
Does this mean that we should eat, drink, be merry, and forget about the future? No — but private investment isn’t the big issue, since it probably doesn’t have a very high rate of return. Blanchard doesn’t say this, but what we should probably be worrying about instead is public investment in infrastructure, which has been neglected and suffers from obvious deficiencies.
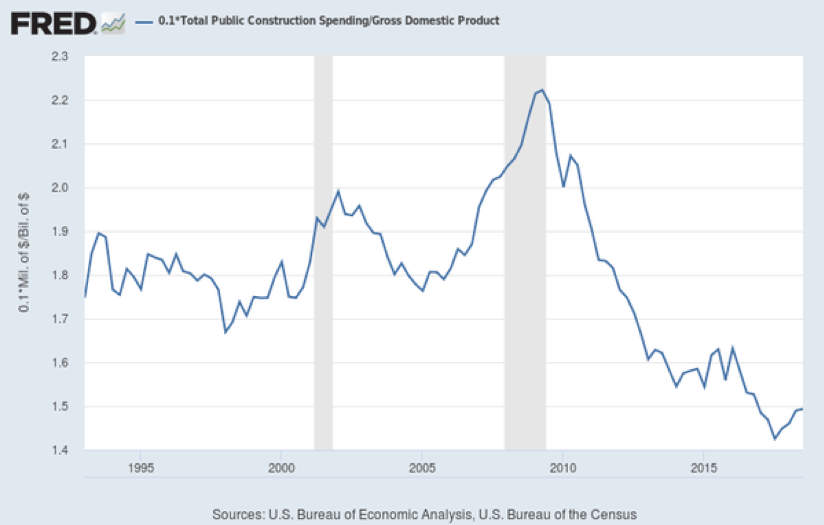
Yet the debt obsession led to less, not more, public investment. Figure 2 shows public construction spending as a percentage of G.D.P. It rose briefly during the Obama stimulus (partly because G.D.P. was down), then plunged to historically low levels, where it has stayed. For all the talk about taking care of future generations, debt scolds have almost surely hurt, not helped, our future prospects.
Figure 2: Total Public Construction Spending as a Share of GDP
Notice that I haven’t even talked about business-cycle-related reasons to stop obsessing over debt. An environment of persistently low interest rates raises concerns about secular stagnation — a tendency to suffer repeated intractable slumps, because the Fed doesn’t have enough ammunition to fight them. And such slumps may reduce long-term growth as well: the experience since 2008 suggests a high degree of hysteresis, in which seemingly short-run downturns end up reducing long-run economic potential.
But even without these concerns, debt looks like a hugely overblown issue, and the way debt displaced unemployment at the heart of public debate in 2010-2011 just keeps looking worse.
This article is adapted from P. Krugman’s January 9, 2019 New York Times Opinion blog.
The New York State Department of Labor reported a gain of 11,800 jobs statewide in December. Employment in the state increased by 122,000 in calendar year 2018, a gain of 1.3% over a year ago, moderately below the nationwide gain of 1.8%. The BLS reported that employment in New York City was flat in December. Employment in the city was up 67,000 in 2018, a gain of 1.5%.
The New York State Department of Labor reported a gain of 6,000 jobs statewide in November. Employment in the state is up 1.2% over a year ago, moderately below the nationwide gain of 1.7%. On balance, the gains were concentrated in New York City as the BLS reported a gain of 7,100 jobs in the city in November. Employment in the city is up 1.5% over a year ago.


