Fotis Siokis
January 7, 2022
In early March 2020, the Covid-19 virus spread quickly across the United States and virulently disrupted every facet of the society. A public health crisis immediately developed into an economic crisis, as severe government restrictions were put in place to mitigate the spread. Unemployment quickly increased from 3.5percent in February to 14.8percent in April 2020, while economic activity measured by GDP dropped by an annualized rate of 31.4percent in the 2nd quarter of 2020. Along with the unprecedented crisis, with lasting deleterious economic effects, the pandemic triggered a health and human tragedy and has laid bare deep divisions in the society.
New York State was hard hit and considered to be the epicenter of the health crisis. At the onset, the reported Covid-19 case numbers (37.1 cases per 100,000 people) were six time higher than the national average, prompting the State government to curtail everyday life. But the attempt to contain the fatal outcomes of the virus spread – by shuttering businesses and schools, along with other measures – exacerbated pre-existing inequities that became especially hard on the most vulnerable people in New York City, predominantly those in low-income households.
In this post, we will examine how the pandemic unequally impacted the people of New York City and in particular in the areas of health and employment/income.
Health
By early December 2021, more than 50 million cases of confirmed infection were reported in the United States, with almost 800,000 deaths, bringing the case fatality rate to 1.6 percent. For the City of New York, approximately1.2 million Covid-19 total cases were reported with around 35,000 deaths, putting the city’s case fatality rate at a shocking 3.1 percent, double that of the country’s average rate. Interestingly enough, according to NYC healthcare statistics, 11 out of every 100 infected New Yorkers were hospitalized.
Furthermore, it became abundantly clear that low-income families and minorities have been disproportionally affected by the Covid-19 pandemic. Many of NYC’s low-income areas suffered the most, with more infected cases and deaths per 100,000 people. Our analysis is based on zip code Covid-19 data, which was provided by NYC health and shows that areas with low per capita income suffered a greater loss than areas with much higher income. Figure 1 depicts the relationship between per capita income and deaths per 100,000 people for each zip code area in NYC.
Figure 1. The relation between Covid-19 deaths and per capita income, per zip code, NYC.
Source: NYC health, Income by zip code and author’s calculations
This outcome could mainly be attributed to two reasons. Most of the low-income people are working as front line workers, the lifeblood of the city, whose jobs require close interaction with the public and therefore being at a higher risk of developing infection from exposure to Covid-19. The majority of the essential workers who continued to work on-site were mostly Black, around 31 percent, compared with 14 percent of Latino and roughly 10 percent of white workers. While many higher-income workers transitioned easily to remote work, low-wage people did not have access to flexible work arrangements and in many cases experienced retaliation for requesting these benefits including paid sick leave. According to a census survey, adults in households with annual incomes of $200,000 or more were nearly six times more likely to have switched to telecommuting in 2020 than those with incomes of less than $25,000.
In addition, a significant percentage of the American population does not have any healthcare insurance coverage and could not bear the heavy cost of the medical bills. Based on data provided by the Bureau of Labor Statistics, 8.6 percent of people, or 28.0 million, in the United States, did not have healthcare insurance coverage at any point during the year 2020. Hispanic/Latinos had the highest uninsured rate (18.3 percent), followed by Blacks (10.4 percent), Asians (5.9 percent), and Whites (5.4 percent). Almost the same percentages applied to the case of NYC. Most of the uninsured people are low-wage people of color and immigrants of legal (and not) statuses who cannot afford to take leave sick from work or seek medical assistance and face unbearably high medical bills. In the case of a Covid-19 infection, uninsured people delayed their medical treatment until they required hospitalization. This fact is evidenced by a recent nationwide survey that shows almost 31 percent of people responded that they had deferred procedures, tests, or care due to high costs within the past year.
Vaccination rate
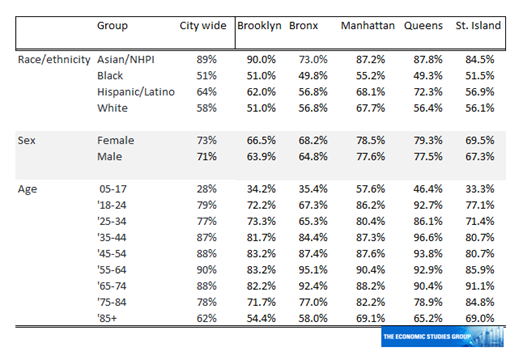
As we moved into late of 2021, the variants of the virus – such as Delta and recently Omicron –- have caused great concern and pose a perpetual threat. Although the percentage of fully vaccinated people in NYC stands at 72 percent as of late December 2021, and is higher than the nationwide percentage (62 percent), there are still significant disparities in vaccination rates, across race and age groups (table 1). Fully vaccinated people of Asian ethnicity pave the way with almost 89 percent, followed by the Hispanic/Latino group, who despite having the highest fatality rate (with 753 deaths per 100,000 people as compared to 691 deaths per 100,000 of black ethnicity) are recorded as having a vaccination rate of 64 percent. In addition, 58 percent of the white group had received both doses, which is higher than the rate of the Black group (51 percent). When it comes to age groups, the percentage of fully vaccinated people of ages 65+ is not greater than that of the age groups of 55-64 and 45-54, despite the fact that the campaign initially was targeted at this oldest age group.
Table 1. Vaccination rate in terms of Race, Sex and Age groups, for NYC (as of December 30th, 2021)
Source: NYC health/Covid-19, Vaccine-data
Figure 2 depicts the percentage of vaccinated people per zip code in relation to the income per capita. Although the vaccination rate is positively correlated with income per capita (as we move to higher per capita income, vaccination rates increase, thus indicating a positive trend), there are some areas with lower income that exhibit very high vaccination rates. For example, the 11355 zip code area in Queens was very hard-hit by Covid-19, but vaccine uptake there is remarkably high – reaching the upper level of 90 percent thus confirming that those who have directly experienced infection were not hesitant to be vaccinated.
Figure 2. The relation between income and the vaccination rate, per zip code in NYC (as of December 2021)
Source: NYC health, Income by zip code and author’s calculations
Employment/Income
Along with the significant differences in fatality rates, the unemployment rate in NYC stands much higher than the national level, with many jobs lost since the outbreak of the crisis. Though employment is rebounding, the unemployment rate is falling slowly settling at 9.0 percent in November 2021 yet more than double the national level of 4.2 percent. The disproportional difference in unemployment rates is largely explained by the specific industries impacted the most by the health crisis since NYC is heavily reliant on tourism, restaurants, hotels and other service industries.
The economic fallout caused many New Yorkers to lose their jobs resulting in major difficulties particularly for low-income workers, especially among women and people of color. In particular, Black and Hispanic/Latino adults (who constitute approximately 75 percent of the front line workers) disproportionately bore the brunt, while 60 percent of whom are women and 50 percent foreign born. Major disparities across race and ethnicities were revealed by a survey conducted by the Center on Poverty and Social Policy, at Robin Hood and Columbia University, as on average around 57 percent of low-income workers in New York City reported loss of employment income. Across ethnicity groups, 59 percent of the Hispanic/Latino group lost income followed by Blacks (55 percent) and whites (43 percent).
Similarly, acute economic suffering changed the landscape and exacerbated food hardship and food pantry use. In Sept-Oct 2020, the rate of food hardship, that is, households that often run out of food, increased to 42 percent, while people seeking food pantry help increased to 32 percent from10 percent just prior to the onset of the health crisis. Unemployed people, people who lost employment income, people of color and people with educational attainment of a high school diploma or less comprise those who needed food assistance.
Figure 3. Food hardship by race.
Source: Columbia University (Center for Poverty and Social Policy) and Robin Hood
Conclusion
The statistics describing the public health crisis in New York City at times conceal the significant unequal impacts across income and demographic groups. These disparities are recognized in federal interventions, with implementation of vast policies aimed at helping vulnerable socioeconomic groups. The provisions of the extended child tax credit, the generous unemployment insurance benefits, numerous cash payments and other policies have played a catalytic role in easing the strains on household budgets and forestalling a massive increase in the poverty level due to the pandemic outbreak, especially among Black and Hispanic/Latino children. Particularly the CARES Act (Coronavirus Aid, Relief, and Economic Security Act,), and later the ARPA Act (American Rescue Plan Act) managed to keep one million New Yorkers out of poverty during 2020 with cash assistance allocated to pay for basic needs such as food, rent, mortgages etc. These programs help to address the inequalities in impact and help to support the economy of the city and the health of New Yorkers.


