

Harvey Gram
May 18, 2018
The distinction between stocks and flows is essential to economic reasoning. In many cases, it is just common sense. If I tell you that my income is $1000, am I a prince or a pauper? Is it $1000 per hour or $1000 per year? Income is a flow, which must have a time dimension in order to be meaningful. In contrast, if I tell you that my wealth is $1,000,000, you should not be puzzled because wealth is a stock, measured at a point in time. Indeed, if I were to say that my wealth is $1,000,000 per week, you should be puzzled. Is it $1,000,000 at the end of each week; or, on average, $1,000,000 at noon on each day of the week? To keep your stocks and flows in line, always ask of an economic variable: What are its units of measurement and do these units have a time dimension?
A simple case: transporting oil
Imagine closing the valves at each end of an oil pipeline. The oil trapped inside is a stock, measured at a “point in time”. The oil inside all the tankers now at sea is also a stock. The flow of oil through a pipeline occurs over a period of time and depends on the pressure applied to the liquid. In the case of tankers at sea, the delivered flow depends on the number and speed of the ships heading towards some destination. Stocks and flows are intrinsic to transportation problems: goods-in-transit are the stocks; deliveries are the flows over periods of time. Part of the cost of transport is the interest (or other income) that could have been earned on the money, metaphorically “tied up” in the stock—a stock that must be maintained in order for any flow to occur.
Accountants live off the distinction: Income Statements and Balance Sheets
An individual’s Balance Sheet records the values of assets and liabilities. These are stocks, measured at a point in time. The word is used generically, while shares (common and preferred) refer to securities listed on the Stock Exchange. Assets minus liabilities is a residual liability, called net worth, which ensures equality of both sides of the Balance Sheet, a requirement of double entry bookkeeping. Negative net worth simply means that liabilities exceed assets and may signal impending bankruptcy.
On the Income Statement, we find flows of income and expenditure, measured over a period of time, often a year. Income minus expenditure is treated as a residual expenditure, called saving, to ensure equality of both sides of the Income Statement. Positive saving implies a current account surplus. When expenditure exceeds income, saving is negative and the current account is in deficit. A nation’s Current Account Balance just extends this notion of surpluses and deficits for an individual to cover an entire country.
The Balance Sheet and the Income Statement interact. If the flow of income exceeds the flow of expenditure (positive residual saving, or a surplus), then at the end of the period over which the flows are measured, either assets are higher, or liabilities are lower (or both). There is a reverse connection as well. To the extent that assets include common and preferred shares, bonds, and real estate, income will necessarily include corresponding dividends, interest, and rent. Likewise, with liabilities: interest on a loan, for example, counts as an expenditure.
Capital gains and losses complicate the picture. Between two dates, the value of each particular asset or liability can change independently of the income statement. Thus, an individual can have a higher stock of wealth at the end of a period during which expenditure exceeds income (negative residual saving), just so long as capital gains exceed capital losses by a sufficient amount to more than offset the individual’s current account deficit.
The US National Income and Product Accounts (NIPA) and Net International Investment Position (NIIP)
A perennial topic in the financial news concerns an entire nation’s Income Statement, taking account of all households, firms, and governments (federal, state, and local). This accounting of flows appears in the National Income and Product Accounts (NIPA). US expenditure on goods and services exceeded US income in almost every year since 1982. (In 1991, the US received a large transfer from Japan during the first Gulf War prompted by Iraq’s invasion of Kuwait, which had threatened oil shipments.) The largest negative value, -$804.2 billion, occurred in 2006. Negative lending to the rest of the world is the same thing as borrowing from foreign individuals, firms, and governments who, in the process, acquire claims on future US income.
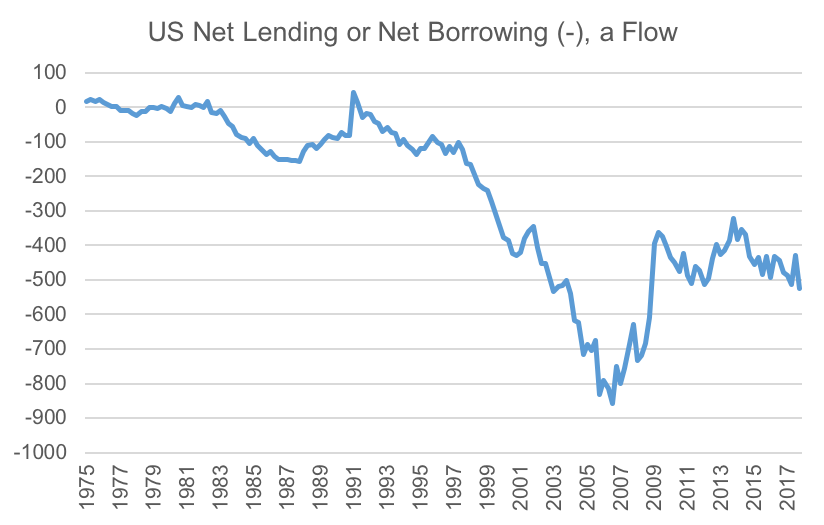
Source: National Income and Product Account, Table 5.1, line 35
Just as an individual cannot spend at a rate that exceeds income without drawing down initial assets or incurring new liabilities, so the US has been either selling its accumulated claims on foreigners or selling new claims on itself to foreigners in recent decades. This occurs on a net basis. US claims on foreigners have actually being going up in every year since 1976, when official data on the US Net International Investment Position (NIIP) was first published. However, foreign claims on the US have being increasing at a faster pace. Such foreign claims take the form of ownership of US money, shares, bonds, land, factories, and buildings. When you read that foreigners own many of the apartments in the most expensive residential areas of New York City, think of this fact as the flip side of US current account deficit in action.
The US NIIP with respect to the rest of the world turned negative in 1989 and has remained so ever since. The most recent entry for 2017 is -$7.845 trillion, an excess of liabilities over assets. This is a stock concept determined by the sum of all past deficits and surpluses from the NIPA flow accounts. Does negative net worth imply impending bankruptcy? Not if our future income (a flow) is sufficient to keep on paying the incomes (e.g. interest and dividends) that foreigners expect to receive on what, for them, are assets.
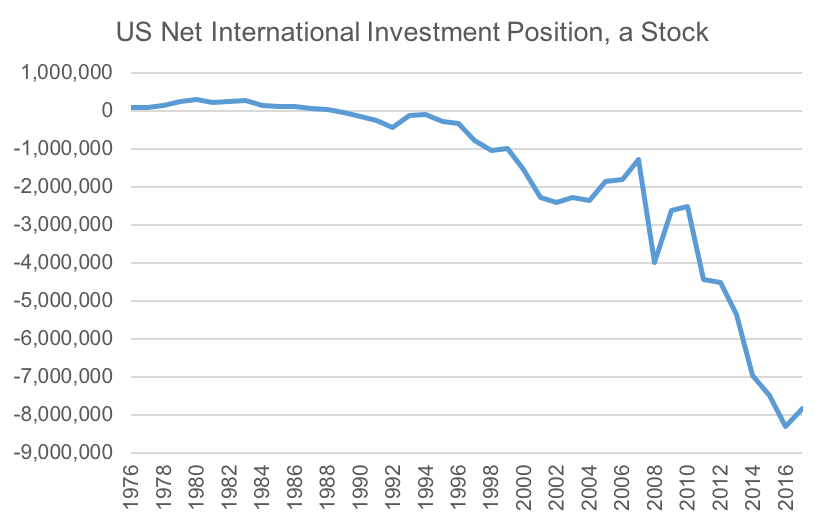
Source: U.S. Bureau of Economic Analysis, International Data, Table 1.1., line 1
For various reasons, there is not always a tight link between the negative annual US net flow rate of saving and the contemporaneous change in the US NIIP. One problem is the difficulty of accurately measuring international trade in services, not to mention private transfers (which may involve illegal transactions). Another is the problem of accounting for capital gains and losses. The US enjoys the ability to borrow in its own currency, i.e. most claims on the US are denominated in US dollars and so, from the US point of view, are unaffected by changes in exchange rates. However, many US claims on foreigners are denominated in foreign currencies, which, in some years, appreciate; thereby increasing the US dollar value of US owned foreign currency denominated claims. Appreciation of the US dollar has the opposite effect. Part of the fluctuation in the US NIIP occurs because of such changes in exchange rates.
Between the individual and the nation as a whole, there are many sub-aggregates. The flow accounts for the consolidated (federal, state, and local) government sector attract attention from politicians and the press when fiscal policy changes are under discussion. Government net lending equals tax receipts minus transfer payments and expenditure on goods and services. As shown below, such lending has been positive in just three years since 1982, corresponding to increasing government surpluses from 1998 to 2000. Economists began to wonder what would happen if the associated retirement of government debt—this is what happens when the government is a net lender—were to continue long enough to leave the financial system without any US Treasuries to hold as a safe asset against which to rank other assets. It turned out to be an “academic” question. Net lending by all branches of government turned negative in 2001, reached a peak of -$1.566 trillion in 2010, and then moved back towards zero. Government borrowing (the negative of net lending) was -$843 billion in 2017.
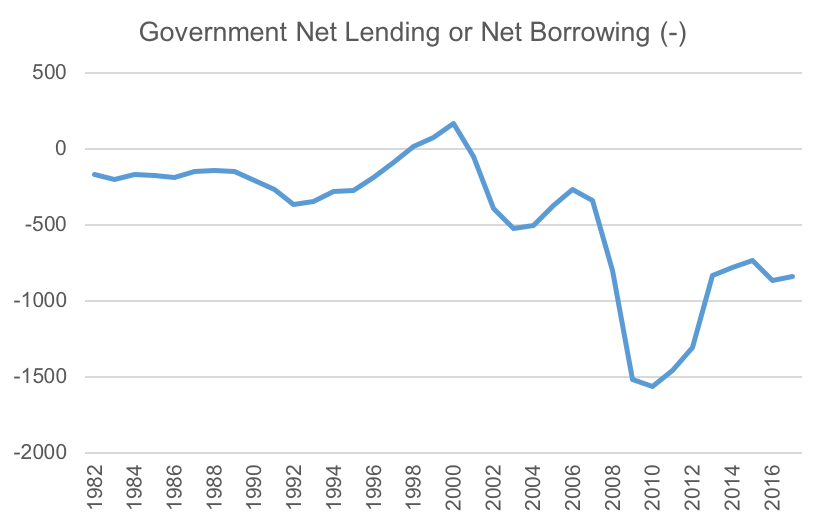
Source: U.S. Bureau of Economic Analysis, NIPA Table 3.1, line 31
The National Income Accounting Identity keeps track of the relationship between the income and expenditure flows of three sectors: private, public, and foreign. If any sector is a net borrower, at least one other must be a net lender, as it is not possible for all to borrow or to lend. The “foreign sector” is the flip side of our current account balance, defined as exports minus imports plus net foreign income (which can be negative) minus US private and public transfers to the rest of the world. If the current account is negative, then the foreign sector has a surplus and so either the private sector or the public sector must have a deficit. This does not imply causation, but provides a coherent framework for discussion. Any policy change (such as tariffs on imports) intended to reduce the nation’s current account deficit will certainly fail unless that policy also increases either the private sector surplus or the government sector surplus (currently negative so that an increase means a smaller negative number).
Of the three sectoral balances, the government’s is the easiest to understand—tax receipts net of transfers (T) minus expenditure on goods and services (G), largely produced by the private sector (G also includes the salaries of government employees and military pay). The foreign sectoral balance is tricky only because it is the nation’s current account balance with the sign reversed. If the US has a current account deficit, then the foreign sector (the rest of the world) has a surplus with the US. The private sector balance requires more thought because of the definitions of “Saving” and “Investment” in the NIPA. Saving is defined as total private after-tax income from all sources (this year’s wages and salaries, rent, interest, and gross profit) minus consumption, which is household expenditure on currently produced durable and non-durable goods and services, except for residential structures. Investment in the NIPA is defined as residential and non-residential fixed investment plus the net change in business inventories. Non-residential (business) investment has three parts: structures (e.g. new factory buildings), equipment, and intellectual property products (e.g. new business software). Accordingly, if private sector saving (S), largely accounted for by the gross retained earnings of the business sector, exceeds investment (I), then the private sector runs a surplus and must be a net lender. Otherwise, it is a net borrower.
Four years of data for the US show various cases of lending and borrowing (in billions of current dollars). In 1965, a private surplus financed a government deficit and a foreign deficit (US current account surplus). In 2000, a private deficit was financed by a government surplus and a foreign surplus (US current account deficit). In 2006, a private deficit and a government deficit were financed by a foreign surplus. In 2016, a private surplus and a foreign surplus financed a government deficit. Note that the current account deficit (foreign surplus) and the government deficit are not necessarily “twins”, as is often suggested. Sometimes they move together, but not always, because the private sector surplus can also change. (In the table, the NIPA Statistical Error is subtracted from the Current Account to obtain, with sign reversed, an “Adjusted Foreign Surplus”. Government Investment in the NIPA is added to G and government depreciation allowances are added to T. These alterations ensure zero column sums for each year, to satisfy the National Income Accounting Identity.)
| 1965 | 2000 | 2006 | 2016 | |
|
|
||||
| Private Surplus: S – I | 28.3 | – 358 | – 137 | 634 |
| Government Surplus: T – G | – 22.9 | 54 | – 448 | – 948 |
| Adjusted Foreign Surplus | – 5.4 | 304 | 585 | 314 |


