
Merih Uctum
July 31, 2017
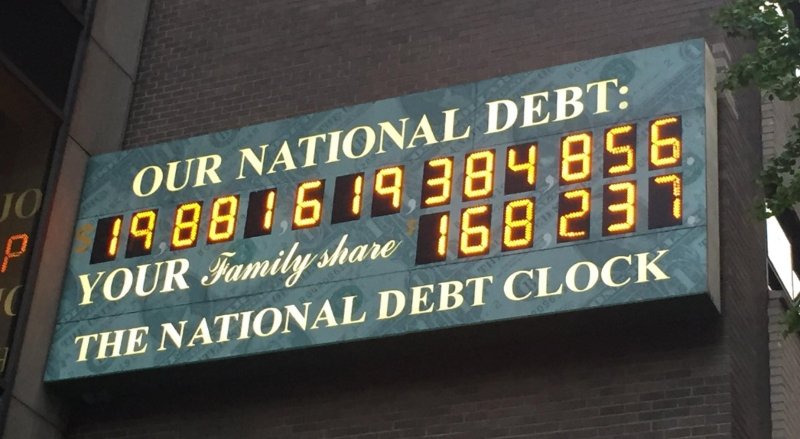
Several times since 2010 the U.S. government has faced the possibility of hitting a debt ceiling, a situation where, if not raised, the U.S. Treasury is not able to borrow to pay its bills on expenditures that were voted and already incurred. Since the U.S. Congress ratifies the spending package, raising the debt ceiling to finance the spending has typically been automatic. But that was not the case in 2013 where the debt ceiling conflict culminated in a government shutdown.
We are fast approaching the next deadline when the government will hit yet another debt ceiling, now expected to be in October of this year. Overall, the U.S. government has a tradition of following responsible policies: as debt rises, the government reacts to it by reducing the primary deficit or generating a primary surplus, defined as tax revenues minus spending excluding debt service, a pattern that was repeated most drastically by the previous administration despite economic weakness.
In this post, we examine the reaction to rising public debt during each administration since the 1970s. We use both descriptive figures and evidence from an econometric study to show that the Republican charge against Democrats is unfounded. Since the early 1970s, Republican administrations have started their mandates with lower levels of debt and have bequeathed higher levels to the Democrats.
Debt and deficit since the 1970s
Although most talk in the media is about debt in nominal U.S. dollars, policy analysts look at the figure as it relates to the productive capacity of the economy and analyze it as a proportion of nominal gross domestic product (GDP). The idea is that as the economy expands, it can support a larger nominal amount of debt or deficit.
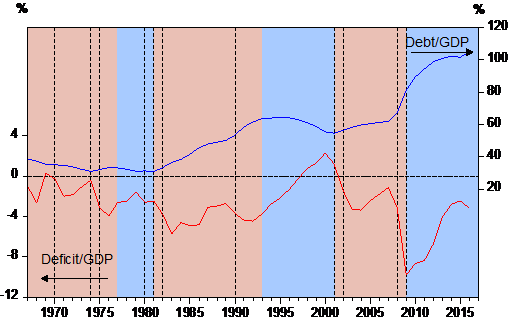
Figure 1 shows the time plots of the debt-to-GDP and the deficit-to-GDP ratios since the late 1960s. The light blue and pink areas represent Democratic and Republican administrations, respectively, and the dotted vertical lines denote the business cycles peaks and troughs as defined by the National Bureau of Economic Research. Looking at these trends leads to two observations: (i) By the beginning of 2013, the debt-to-GDP ratio (blue line) reached a level unprecedented since 1973, equaling levels attained only during the Great Depression of 1933. However, public debt by itself is simply the result of the cumulated deficit, which is a reflection of public policy and business cycles (red line). (ii) An inspection of the behavior of the deficit line shows that the recent debt explosion was caused by the spectacular increase in the deficit during the Great Recession that started under the Bush administration. By contrast, during the subsequent administration, the government reversed this negative trend by reducing the deficit before the impact of recession ended and continued doing so before the recovery was established.
Looking back, it is interesting to note that over this period Republican administrations started their mandate with low deficits and end with higher deficits. By contrast, Democratic administrations start with higher deficits and end with lower deficits.
Figure 1: US Public Debt and Deficit Ratios
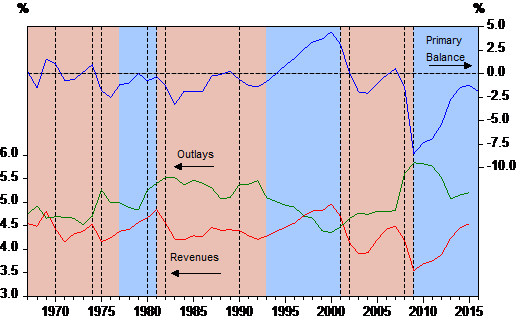
We can dig deeper into these figures by examining the two components of the deficit (Figure 2), outlays (red line) and revenues (green line), along with the primary deficit (blue line). The primary deficit follows closely the total deficit in Figure 1. It has been mostly negative since the late 1960s but turned significantly positive during the Clinton Administration with a combination of decreased spending and increased revenues. During the Bush Administration, the two lines diverged, first because of tax cuts and increases in spending due to the expansion of Medicare, second because of the financing of two wars through borrowing, and finally because of the Great Recession. Under the Obama Administration, both lines begin to converge again.
Figure 2: US Primary Balance, Outlays, and Revenues (ratios to GDP)
Is the U.S. government fiscally responsible?
One way of verifying the solvency of government policies is to look at whether the government systematically reacts to debt accumulation by generating a primary surplus or reducing the primary deficit. We saw in Figure 2 that the primary deficit is often reduced. But is this a systematic policy or is it simply due to improving economic activity that raises tax revenues and cuts fiscal stabilizers? Using an econometric technique, we estimate a model of a government reaction to the buildup of debt and compare the government behavior between the two administrations. This technique yields an estimate of the impact of government policy on the deficits and debt apart from any effects of an improving economy.
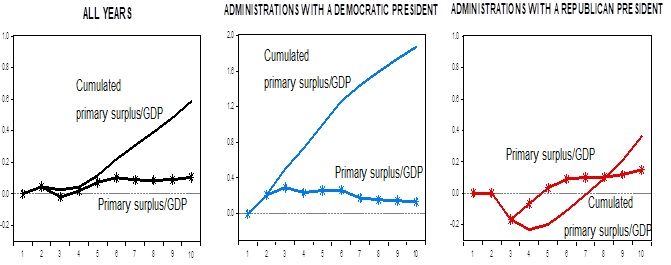
Figure 3 illustrates what happens to primary balances over a ten-year period following a 1% increase in the Federal debt. We find that overall, the US government starts raising the surplus within a year (starred line), so the US debt is sustainable (left panel). However, the pattern of changes in the surplus differ dramatically between administrations with a Democratic President and Republican President. While the Democratic President Administration immediately starts generating a surplus and paying the debt back (middle panel), under the Republican President Administration the surplus rapidly vanishes and the government starts adding to federal debt (right panel). Changes in debt can be best seen in Figure 3 where the primary balances are cumulated (straight line). At the end of the eigth year, the Democratic President Administration reduces the debt/GDP ratio by more than the initial 1% increase, while the Republican President Administration reduces it only by 0.1%.
Figure 3 Response of the Primary Surplus to a 1% Increase in Debt (ratios to GDP)
Debt-ceiling crises and a dim picture in the future
The costs associated with a failure to raise the debt ceiling are multilayered and go well beyond the mere government shutdown. In addition to the economic cost, successive debt-ceiling crises create a much more harmful uncertainty about the ability of the U.S. government to honor its commitments. This can affect its credit standing, as happened in 2012 when the U.S. AAA rating was downgraded and can hurt the dollar’s international reserve currency status. The dollar has enjoyed an unchallenged supremacy, which lowers U.S. borrowing costs by 0.8 to 1 percent. The Government Accountability Office estimated that the probability of default increased the government’s borrowing cost by 0.5 percent in the last crisis in 2011. In the long term, if the reputation of the U.S. economy is damaged, this could result in a permanently higher cost of borrowing and bigger deficit and debt.
However, both an aging population and rising interest rates put greater pressure on the deficit in the next 30 years. The Congressional Budget Office predicts that by 2047 the deficit will grow back to 9.8 percent of GDP. Discretionary spending (education, welfare, infrastructure, etc.), will amount to only 7.6 percent of GDP or a quarter of total federal government spending. Cutting discretionary spending as proposed by the Republican administrations not only slows down the economy and fails to put a dent into the deficit but as the European experience has shown, it can exacerbate budget problems during a slowdown by reducing revenues. This forecast into the future clearly calls for a national discussion about our social welfare priorities if we are to build a fiscally sustainable future.


