

Richmond Kyei Fordjour
September 15, 2017
Conventional wisdom tells us that a rise in interest rates hurts the real estate sector since higher mortgage rates discourage first-time homebuyers and raises costs of existing mortgages. Surprisingly, the recent trends in mortgage rates and in housing market indices do not support this view. This article examines the facts in the New York Metropolitan area and the United States.
Interest rates—Government bond yields (10-year Treasury) and the 30-year Primary Mortgage Rate (the Freddie Mac Primary Mortgage Market Survey Rate)—have been rising since the end of the 3rd quarter of 2016, through the 1st quarter of 2017, and only briefly abated in the 2nd Quarter of 2017 (this year) and marginally came down (Figure 1).
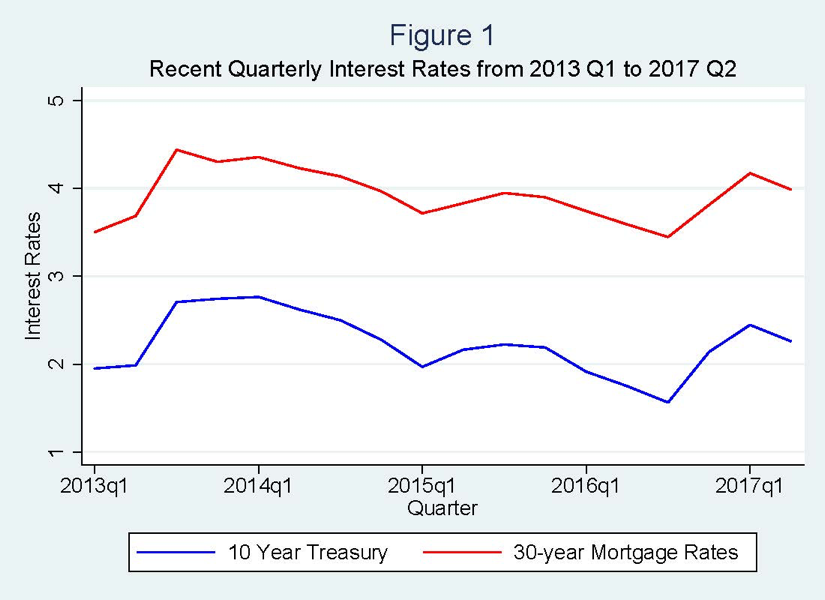 Source: Federal Reserve H.15 and Freddie Mac.
The rise in interest rates, however, does not appear to have affected home prices in the United States in general, and the New York metropolitan area in particular (Figure 2). The Home Price Index for the New York-New Jersey Metropolitan Statistical Area has continued to rise in the same period:
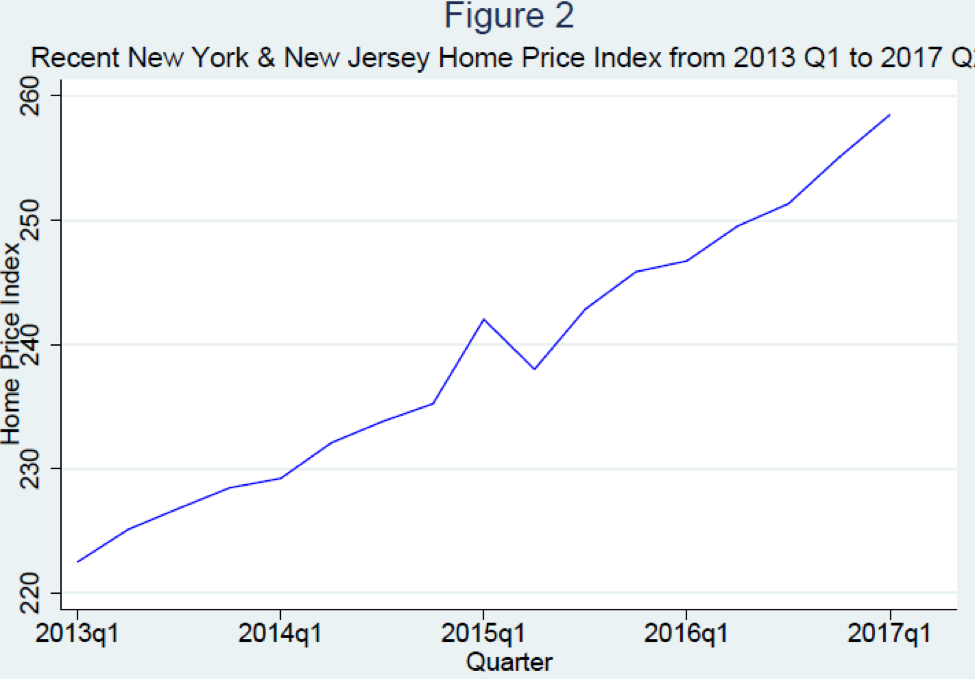 Source: Federal Housing Finance Agency.
This observation may run contrary to logical expectation, since higher interest rates on mortgage loans means home buyers shall pay more in mortgage interest when they purchase their homes, and therefore the demand for housing may be reduced and dampen home price, and subsequently the Home Price Index. Putting this observation in a historical context, however, appears to provide some illumination. As Figure 3 illustrates, this is not the first time the NY-NJ Home Price Index has continued to rise in spite of rising mortgage lending rates. Positive correlations between them have been observed during other periods such as 2003 Q2-2006 Q3, 2013 Q1-2013 Q4.
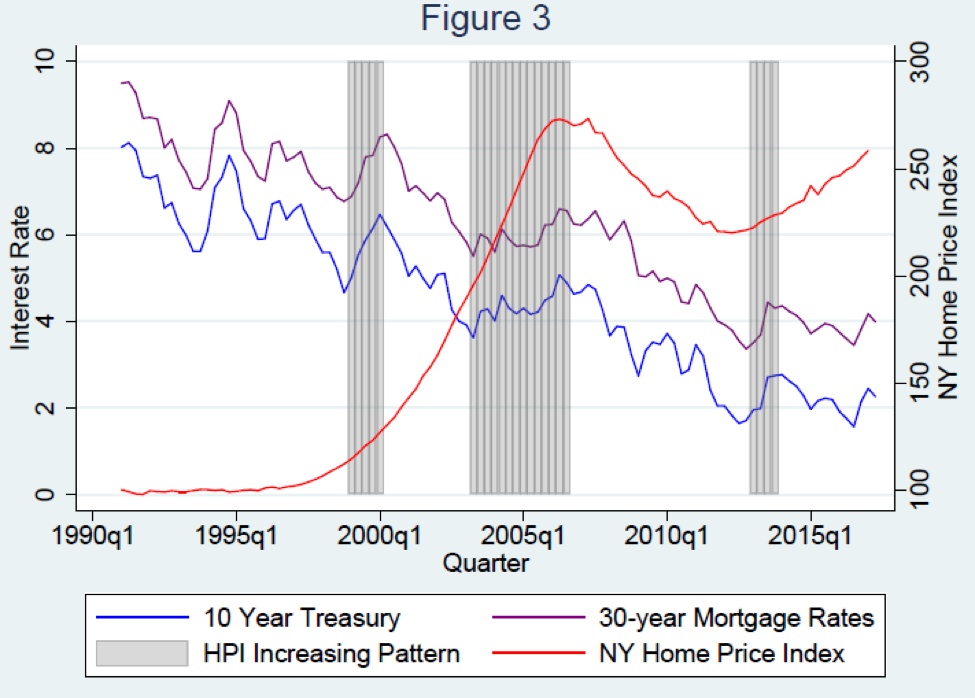 Source: Federal Reserve H.15 and Freddie Mac; Federal Housing Finance Agency.
A closer inspection of the data reveals some clues as to why this pattern occurs. Consider the Mortgage – Treasury spread, calculated as the difference between the Primary 30-year Mortgage rate and the Treasury 10-year bond’s yield. The spread is a good proxy for measuring the relative cheapness of mortgage interest rates, because an investor considering making a fixed-income investment would compare yields on the government bond (the risk-free benchmark) versus that of the secondary mortgage market (the Mortgage Backed Security). Since Mortgage Backed Securities typically have average durations of less than 30 years and considering the relative flatness between the 10 and 30-year points on the Treasury yield curve, these two assets have broadly equivalent maturity. Examining the trend in the spread and the change in the home price index, which is also called home price appreciation rate, yields an interesting insight into the correlation between the two series (Figure 4). A simultaneous increase in both series indicates that a relative decline in the mortgage rates is accompanied by home price appreciation, consistent with the conventional wisdom.
The data indeed indicates that except for one subperiod, overall the home price appreciation rate moves together with the spread. During 1999 Q1-2000 Q1 the high spread indicating relatively expensive borrowing rates are likely to have come about as a consequence of high sustained demand, as home prices had also been rising rapidly in that same period. After 2003 the spread abated then reverted and stabilized until the beginning of the financial crisis. During this period, the increase in the relative cost of mortgages is also accompanied by a steep devaluation of the Home Price Index when the real estate market slumped in the New York metropolitan area.
After the brief spike in the spread in 2008 when the Fed was embarking on aggressive monetary easing in the wake of the financial crisis, the spread converged with the home price appreciation rate—from 2010 onwards—and the two have been trending together, an indication that demand for homes and mortgage interest costs were roughly in balance.
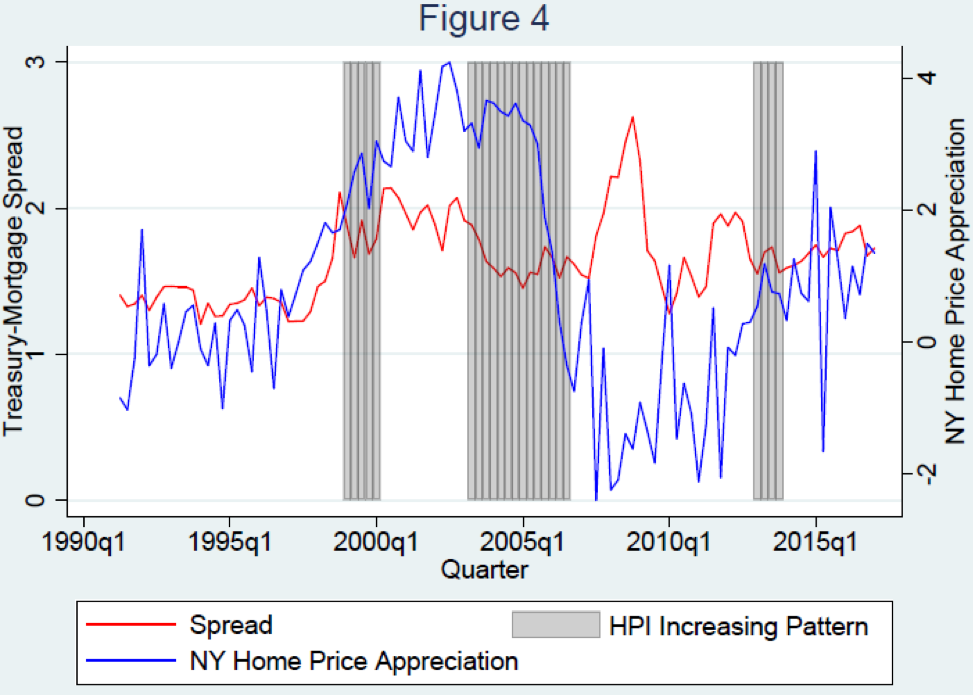 Source: Federal Reserve H.15 and Freddie Mac; Federal Housing Finance Agency and author’s calculations.
Comparing these historical occurrences by looking at the movements of spread and that of the home price appreciation rate, rather than considering only the movements in the levels of mortgage rates and the Home Price Index, we have been able to gain better insight into the dynamics underlying these observations. Accordingly, the Home Price Index has been broadly rising in the face of a rising level of the spread or a demand-driven increasing relative cost of mortgages.


